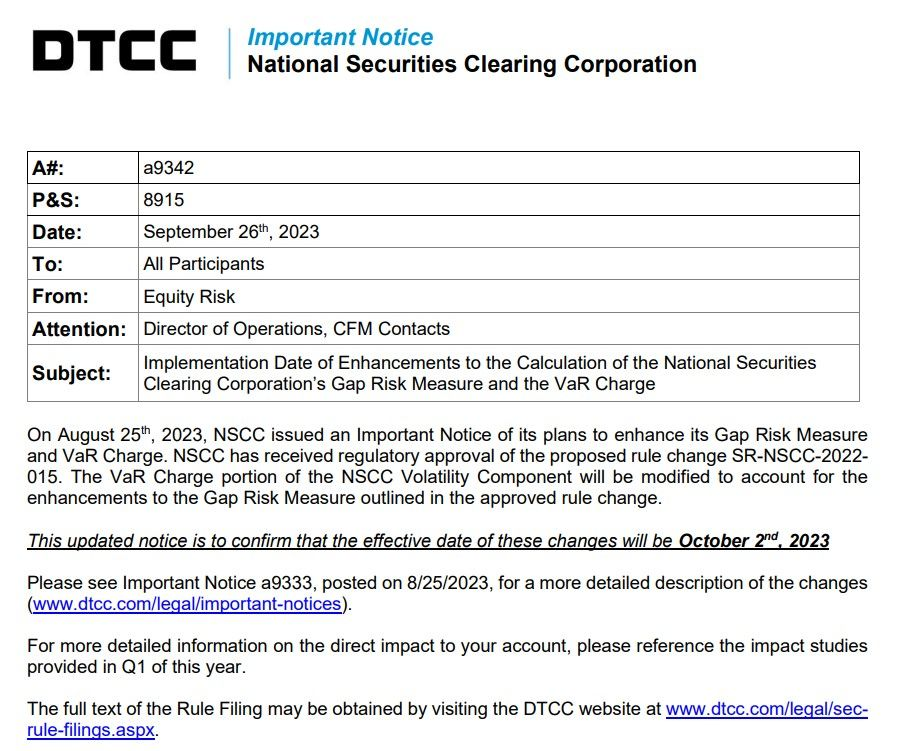
NSCC provided notice to its Members confirming VaR Charge changes effective 10/2/23. Why? IDIOSYNCRATIC RISK! I believe these changes help set the stage for MOASS.
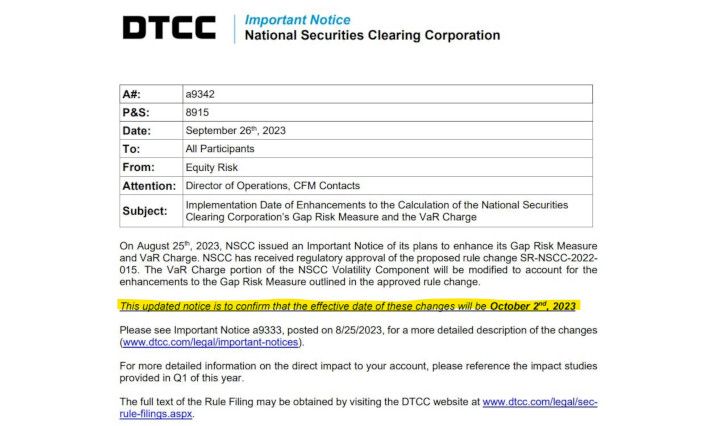

This Follows up the planned implementation announcement from 8/25/23:

I'd like to call folks attention to something called out in the 8/25 announcement but not today's:

"Haircuts"
It just so happens, on 9/22 NSCC has also submitted to update the definition around "Haircuts":


This is a whopper of a statement:
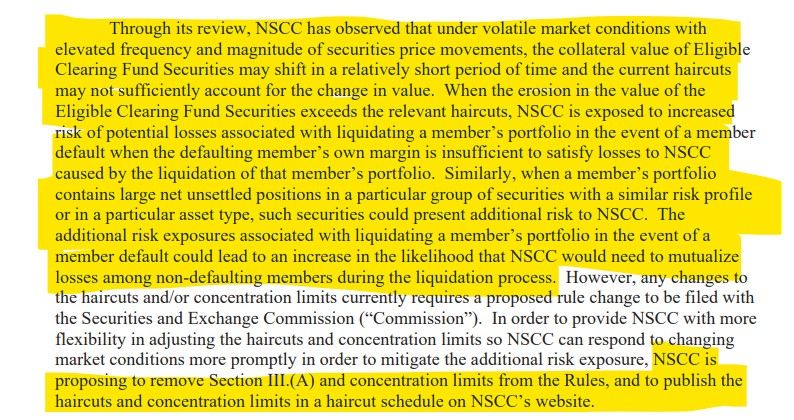
- "Through its review, NSCC has observed that under volatile market conditions with elevated frequency and magnitude of securities price movements, the collateral value of Eligible Clearing Fund Securities may shift in a relatively short period of time and the current haircuts may not sufficiently account for the change in value."
- "When the erosion in the value of the Eligible Clearing Fund Securities exceeds the relevant haircuts, NSCC is exposed to increased risk of potential losses associated with liquidating a member’s portfolio in the event of a member default when the defaulting member’s own margin is insufficient to satisfy losses to NSCC caused by the liquidation of that member’s portfolio."
- "Similarly, when a member’s portfolio contains large net unsettled positions in a particular group of securities with a similar risk profile or in a particular asset type, such securities could present additional risk to NSCC."
- "The additional risk exposures associated with liquidating a member’s portfolio in the event of a member default could lead to an increase in the likelihood that NSCC would need to mutualize losses among non-defaulting members during the liquidation process."
So why are they keen on doing all of this?

It seems they are looking to speed up the process by which haircut changes are implemented--1 business day notices on the website vs having to go through the rules process.

"Concurrent with moving the haircuts and concentration limits from the Rules to the website, NSCC is also proposing to reconfigure the categories relating to Treasury securities haircuts by moving the Treasury Inflation-Protected Securities (“TIPS”) to a separate category and increasing the haircut levels for TIPS."

Bloomberg a month ago:
The market for Treasury Inflation-Protected Securities is teaching investors a harsh lesson about interest-rate risk, ramping up the focus on this week’s auction of the debt.
Despite sticky price pressures, long-maturity TIPS are on track for their biggest monthly loss this year. Investors have driven up yields on all manner of long-dated bonds this month amid concern over the Treasury’s swelling borrowing needs and — ironically for TIPS — the risk that inflation may spike again or not decline smoothly.
NSCC is changing the haircut level applicable for TIPS as follows:

Side note, notice how the NSCC has previously DRASTICALY under collected on haircuts compared to other SROs?:


The rule will be implemented within 60 days of approval:

NSCC SCHEDULE OF HAIRCUTS FOR ELIGIBLE CLEARING FUND SECURITIES:

This is an interesting tidbit:

Wut Mean?
- It seems they are looking to speed up the process by which haircut changes are implemented--1 business day notices on the website vs having to go through the rules process.
- NSCC is also proposing to reconfigure the categories relating to Treasury securities haircuts by moving the Treasury Inflation-Protected Securities (“TIPS”) to a separate category and increasing the haircut levels for TIPS.
- This will be in effect within 60 days of the rule being approved.
Ok, with haircut changes reviewed, back to the VaR notice at hand. Why are they doing this again? IDIOSYNCRATIC RISK!

Wut Mean?:
- The NSCC approved Enhancements to the Gap Risk Measure & the VaR Charge.
- VaR tinkers with the mechanics that would have defaulted Robinhood & Others 1/28/21.
- The NSCC, previously saved them by sacrificing retail, in allowing Robinhood and others to alter their margin charges and freezing the buy button.
- The gap risk charge will now be added to a member's total VaR Charge whenever it applies. Previously, it only replaced the VaR Charge when it was the largest of three calculations. This addition improves the ability to handle unique risks.
- The gap risk charge will now consider the two largest positions in a portfolio instead of just the single largest one. This means the charge could apply when the combined value of these two largest positions exceeds a certain concentration threshold. This change offers better coverage for potential concurrent gap events in two major positions.
- The way the gap risk haircut (a percentage reduction) is determined will be revised. The minimum haircut for the largest position will be reduced from 10% to 5%, and a new minimum of 2.5% will be set for the second-largest position. This change in methodology is to ensure an appropriate margin level.
- NSCC will modify the criteria for ETF positions that are excluded from the gap risk charge. Instead of just excluding "non-index" positions, NSCC will exclude "non-diversified" positions, factoring in characteristics like the nature of the index the ETF tracks or whether the ETF is unleveraged. This change aims to be more precise about which ETFs are prone to gap risk and should improve transparency for members.
- Regarding the gap risk charge for securities financing transactions cleared by NSCC, the methodology of which already includes the gap risk charge as an additive component to margin and which would not change as a result of this proposal, (ii) to make clear that the gap risk charge applies to Net Unsettled Positions, (iii) to remove an unnecessary reference, (iv) to reflect that NSCC considers impact analysis when determining and calibrating the concentration threshold and gap risk haircuts, and (v) to make other technical changes for clarity).
- NSCC's proposed changes approved for the gap risk charge, ensuring the collection of adequate margin to address risks from members’ portfolios.
- Based on provided confidential data and impact study, the changes offer better margin coverage than the current methodology.
- Making the gap risk charge additive should help NSCC address more idiosyncratic risk scenarios in concentrated portfolios compared to the existing methodology.
- Adjusting the gap risk calculation for the two largest positions with two separate haircuts, based on backtesting and impact analysis, allows NSCC to cover risks from simultaneous gap moves in multiple concentrated positions.
- Changing criteria for ETFs in the gap risk charge (from non-index to non-diversified) enhances NSCC's precision in determining which ETFs are susceptible to gap risk events, improving risk exposure accuracy.
- The Proposed Rule Change equips NSCC to better manage its exposure to portfolios with identified concentration risk, hence limiting its risk exposure during member defaults.
- NSCC's rule ensures uninterrupted operation in its critical clearance and settlement services, even during a member default, by having adequate financial resources.
- The changes minimize the chance of NSCC tapping into the mutualized clearing fund, thereby reducing non-defaulting members' risk exposure to shared losses.
- The Commission believes these proposed changes will help NSCC safeguard securities and funds in its custody or control, aligning with Section 17A(b)(3)(F) of the Act.
The approved rule aims to address the potential increased idiosyncratic risks NSCC might face, especially regarding the liquidation of a risky portfolio during a member default:
- After reviewing NSCC’s analysis, the Commission agrees that the new rule would result in improved backtesting coverage, reducing credit exposure to members.
- The Commission asserts that this rule will empower NSCC to manage its credit risks more effectively, allowing it to adapt to backtesting performance issues, market events, structural changes, or model validation findings.
- This proactive management ensures NSCC can consistently collect enough margin to cover potential exposures to its members.
- The goal is to produce margin levels that align with the risk attributes of these concentrated holdings, especially securities more vulnerable to gap risk events.
- The rule enhances NSCC's ability to recognize and produce margins that match the idiosyncratic risks and attributes of portfolios that meet the concentration threshold.
- Broadening the gap risk charge to an additive feature and focusing on the two largest non-diversified positions will help NSCC better manage the idiosyncratic risks tied to concentrated portfolios.
- Given the additive nature of the gap risk charge, the Commission agrees that the adjustments to its calculation, like establishing floors for gap risk haircuts for the two largest positions, are aptly designed to handle NSCC’s idiosyncratic risks exposure during member defaults.
- Introducing specific criteria to determine which securities fall under the gap risk charge will enable NSCC to pinpoint those more prone to idiosyncratic risks, ensuring ETFs identified as non-diversified are included.
Implementation:
As covered above, the VaR component is effective 10/2/23.
So what should these changes mean?:
- Increased Margin Requirements: With the changes in the methodology, members should face higher margin requirements. The addition of the gap risk charge to the VaR Charge (as opposed to it only replacing the VaR charge when it's the largest of three calculations) would mean that members should be required to deposit more funds to NSCC to cover this risk.
- Multiple Significant Positions Impact: Previously, the gap risk charge considered only the largest non-index position. By considering the two largest positions in a portfolio, the margin requirements should rise for members who have significant short positions in multiple securities, especially if those securities are prone to volatile price movements....
- Revised Haircut Percentages: The change in haircut percentages implies concerns about the risk. The lowered percentages (from 10% to 5% for the largest position and a new 2.5% for the second-largest position) mean the gap risk charge should be applied more frequently.
- New Criteria for ETFs: By moving from "non-index" to "non-diversified" as the criteria for exclusion from the gap risk charge, there's a more refined approach to evaluating which ETFs are prone to gap risk. This should impact members who previously used certain ETF positions as a strategy to manage their margins...
- Increased Transparency: Improved transparency in terms of which ETFs are prone to gap risk means that members can make more informed decisions. However, it also implies that any loopholes or strategies that were previously employed might no longer be valid, leading to strategy changes or potential increased costs for some members.
How does this lead to MOASS?:
- The changes should lead to higher margin requirements for those with short positions in volatile stocks like GameStop. The higher the costs, the more pressure on short sellers to close their positions, especially if they face liquidity challenges.
- If short sellers can't meet their margin requirements, they'll be forced to buy back the shares to close their positions, leading to a surge in demand and subsequently, a rise in share price.
- As the stock price rises due to forced buybacks, other short sellers face further margin calls, creating a snowball effect where more short sellers are forced to buy back shares, pushing the price up even further until lift off...
Oh yeah:
- They are REALLY concerned about idiosyncratic risk.

Where might all the volatility come from?
Before I go any further, this is not a post encouraging anyone to mess with 0DTE options or options in general.
Rather, this is a recap of a tool being leveraged to suppress volatility and the implications of it being out of control to the broader market.
Sources for this part of the post:
- https://www.marketwatch.com/story/trading-in-risky-0dte-stock-options-hits-record-and-could-a-stock-market-selloff-traders-say-41a35495
- https://www.reuters.com/markets/us/rise-0dte-stock-options-how-they-could-be-risk-markets-2023-02-22/
- https://www.washingtonpost.com/business/2023/06/13/what-are-zero-day-stock-options-why-do-they-matter-quicktake/2aa48fdc-09fd-11ee-8132-a84600f3bb9b_story.html
- https://www.marketwatch.com/story/here-are-5-ways-that-trading-in-0dte-stock-options-is-changing-how-the-market-works-607b03c5
What Are Zero-Day (0DTE) Options?:
- Options are contracts that allow traders to bet on the price direction of assets like stocks.
- They can choose to buy (call) or sell (put) at a specified price within a set time.
- 0DTE options have a super-short time frame of 24 hours, so decisions on whether to use them or lose the money spent on them must be made quickly.
Why Are They Used?:
- 0DTE options can be used for betting on market changes or for hedging against them.
- Investors can buy puts to protect against price drops or to bet on them.
- Traders can also sell options, hoping they expire with no value to earn extra income.
- Shorter options like 0DTE are cheaper due to their low chance of value by expiration. They are popular for betting on short-term price changes.
- An analysis by JPMorgan Chase & Co. found that two-thirds of profits from 0DTE came when the option was sold in the first minute after being originated.
Risks:
Short-dated options, which are very sensitive to changes in the price of their underlying asset.
- Take Oct. 28, 2022, when the S&P 500 jumped more than 2% to close above 3,900. Calls expiring that day with a strike at 3,850 surged to $45.80 from $2.90 — a stunning gain of 1,479%.
- On the other hand, puts maturing the next session with an exercise price of 3,750 tumbled 97% to 65 cents, after having more than doubling to $24.27 during the previous day.

How I understand this:
- Dealers who are short options (i.e., they have sold options) are typically short gamma.
- Being short gamma means that as the underlying asset's price moves, the dealer's position will become more and more unhedged in the opposite direction. If the underlying asset price goes up, a dealer who is short gamma will end up being more and more short the underlying. Conversely, if the underlying price goes down, they will become more and more long.
- Because of the increasing unhedged exposure as the underlying price moves, dealers who are short gamma often have to re-hedge their positions frequently. This means they have to buy when the underlying asset's price is rising and sell when it's falling. This can exacerbate price movements, especially in volatile markets.
- Being short gamma can be profitable in stable, non-volatile markets because the dealer collects the option premium when selling options. However, in volatile markets, the frequent need to re-hedge can lead to significant losses....
I believe 0DTE's will be the trigger of the gamma ramp:

Trading in stock options with extremely limited lifespans is surging to record highs just as the 2023 U.S. stock-market rally is showing signs of stalling.
- In the past this this trade has been associated with subdued volatility in markets
- Peng Cheng, a managing director at JPMorgan Chase & Co., told MarketWatch that over the past month, only 4.3% of total 0DTE volume has been handled by retail traders, while the rest has been institutional traders and market makers.
- Data show volume tapered off in June after the S&P 500 index saw a decisive break above 4,200 as the 2023 stock-market rally accelerated.
- More recently, volumes have started to bounce back as the rally has slowed.
- 0DTE traders have re-emerged to try to profit from these wider swings, experts said
- Brent Kochuba, founder of SpotGamma, which provides options data and analytics, said elevated 0DTE volatility is typically associated with mean reversion.
- Data suggest 0DTE strategies could keep the market “pinned” to the 4,500 level on the S&P 500.
- “When the market tried to rally over 4,500 on Friday, a large 0DTE flow emerged and smacked the market back down.”
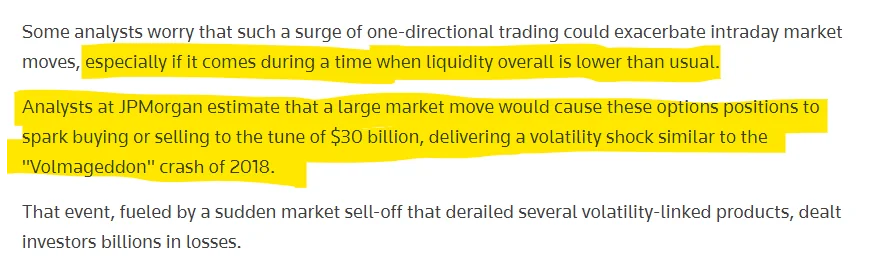
- Oppenheimer & Co. fear that overlapping crowded positions in derivatives markets that profit from a phenomenon known as “volatility suppression” could tip over into a selloff should the Cboe Volatility Index, otherwise known as the Vix or Wall Street’s “fear gauge,” continue to climb, as it has over the past week.
- The market has recently tested the daily ranges within which option market makers expect it to trade (for example the fitch downgrade)
- When this happens, it increases the risk that market makers will need to rapidly hedge their positions, potentially sparking a sudden surge in the Vix and corresponding selloff in stocks.
- 0DTEs are known for suppressing expectations about how volatile the market might be as measured by the Vix, since 0DTE trading volumes aren’t factored into the fear gauge.
Oh yeah, 0DTE's are spreading:

At the same time, the Fed's Enhanced Financial Accounts (EFAs) on Hedge Funds:
Hedge Fund liabilities hit new all time high in 2023:Q1
- This table shows the aggregate assets and liabilities of hedge funds that file Form PF with the Securities and Exchange Commission.
- Unlike table B.101.f in the regular Financial Accounts publication, which reports assets and liabilities of domestic hedge funds only, this table presents data on all hedge funds that file Form PF, both domestic and foreign.
- The first part of the table reports the long position for the respective asset categories, with derivative exposure being excluded.
- The second part of the table reports the liability items, which detail the source of borrowing. A memo item reports total long derivative exposure.
| Date | Total assets | Foreign currency; asset | Deposits; asset | Other cash and cash equivalents; asset | Money market fund shares; asset | Security repurchase agreements; asset | Total debt securities; asset | Treasury securities; asset | Corporate and foreign bonds; asset | Other debt securities; asset | Total loans; asset | Leveraged loans; asset | Other loans; asset | Corporate equities; asset | Miscellaneous assets; asset | Total liabilities | Total security repurchase agreements; liability | Security repurchase agreements with domestic institutions; liability | Security repurchase agreements with foreign institutions; liability | Total loans; liability | Loans, total secured borrowing via prime brokerage; liability | Loans, secured borrowing via domestic prime brokerages ; liability | Loans, secured borrowing via foreign prime brokerages; liability | Loans, total other secured borrowing; liability | Loans, other secured borrowing from domestic institutions; liability | Loans, other secured borrowing from foreign institutions; liability | Loans, total unsecured borrowing; liability | Miscellaneous liabilities; liability | Total net assets | Derivatives (long value) |
|---|---|---|---|---|---|---|---|---|---|---|---|---|---|---|---|---|---|---|---|---|---|---|---|---|---|---|---|---|---|---|
| 2012:Q4 | 4254.22 | 51.97 | 116.9 | 309.04 | 74.9 | 347.61 | 1708.78 | 654.49 | 993.65 | 60.64 | 133.35 | 108.84 | 24.5 | 1148.48 | 363.19 | 1834.19 | 602.76 | 294.72 | 308.04 | 976.64 | 764.23 | 599.9 | 164.34 | 209.83 | 139.66 | 70.18 | 2.58 | 254.78 | 2420.03 | 8311.76 |
| 2013:Q1 | 4729.57 | 75.49 | 105.4 | 294.93 | 76.49 | 412.56 | 1942.94 | 755.22 | 1135.35 | 52.37 | 136.65 | 110.5 | 26.15 | 1292.39 | 392.73 | 2137.6 | 657.58 | 306.58 | 350.99 | 1153.52 | 906.42 | 715.64 | 190.78 | 243.46 | 126.91 | 116.56 | 3.64 | 326.5 | 2591.97 | 5900.76 |
| 2013:Q2 | 4851.63 | 71.39 | 116.99 | 320.31 | 77.14 | 543.69 | 1884.14 | 664.32 | 1134.43 | 85.39 | 140.48 | 107.03 | 33.45 | 1332.26 | 365.23 | 2217.88 | 779.15 | 404.36 | 374.79 | 1205.52 | 948.27 | 714.11 | 234.16 | 251.49 | 118.5 | 132.99 | 5.76 | 233.21 | 2633.75 | 4844.51 |
| 2013:Q3 | 4998.9 | 70.3 | 125.02 | 336.5 | 85.55 | 508.26 | 1901.87 | 673.41 | 1171.91 | 56.56 | 143.17 | 108.38 | 34.79 | 1424.21 | 404.02 | 2248.64 | 668.15 | 327.45 | 340.7 | 1252.65 | 958.63 | 759.94 | 198.69 | 286.63 | 142.36 | 144.27 | 7.39 | 327.84 | 2750.26 | 4930.88 |
| 2013:Q4 | 5351.05 | 70.85 | 134.01 | 381.27 | 126.79 | 474.71 | 1930.15 | 657.51 | 1229.22 | 43.42 | 149.23 | 102.68 | 46.55 | 1618.21 | 465.82 | 2294.94 | 579.54 | 290.07 | 289.47 | 1392.8 | 1083.19 | 862.97 | 220.22 | 301.88 | 144.85 | 157.04 | 7.73 | 322.6 | 3056.11 | 5253.12 |
| 2014:Q1 | 5544.42 | 82.19 | 146.01 | 386.11 | 128.38 | 566.71 | 1987.79 | 679 | 1261.15 | 47.65 | 154.05 | 110.86 | 43.19 | 1661.02 | 432.17 | 2437.48 | 558.01 | 257.69 | 300.32 | 1461.47 | 1139.93 | 910.72 | 229.21 | 310.31 | 124.12 | 186.19 | 11.24 | 418 | 3106.94 | 5260.63 |
| 2014:Q2 | 5778.15 | 78.68 | 154.67 | 398.53 | 139.37 | 572.34 | 2046.01 | 623.27 | 1360.17 | 62.57 | 161.68 | 113.64 | 48.04 | 1775.19 | 451.68 | 2511.18 | 605.29 | 275.4 | 329.89 | 1433.12 | 1123.5 | 876.48 | 247.02 | 296.67 | 106.49 | 190.18 | 12.94 | 472.77 | 3266.97 | 5166.33 |
| 2014:Q3 | 5883.62 | 86.13 | 153.11 | 421.41 | 132.19 | 617.16 | 2131.29 | 710.54 | 1351.63 | 69.11 | 160.51 | 113.41 | 47.1 | 1742.82 | 439 | 2641.73 | 635.54 | 293.52 | 342.02 | 1441.53 | 1114.58 | 847.2 | 267.38 | 314.08 | 121.19 | 192.89 | 12.87 | 564.66 | 3241.88 | 5305.47 |
| 2014:Q4 | 5925.22 | 77.59 | 161.87 | 426.46 | 166.37 | 553.59 | 2058.62 | 659.94 | 1334.33 | 64.35 | 168.14 | 116.34 | 51.81 | 1809.85 | 502.72 | 2564.85 | 614.55 | 302.28 | 312.27 | 1486.4 | 1168.91 | 896.95 | 271.97 | 307.43 | 122.59 | 184.85 | 10.05 | 463.9 | 3360.36 | 4654.88 |
| 2015:Q1 | 6350.43 | 91.42 | 162.73 | 398.79 | 159.67 | 583.07 | 2337.87 | 754.92 | 1516.57 | 66.39 | 167.34 | 116.63 | 50.71 | 1887.13 | 562.41 | 2814.97 | 728.29 | 375.16 | 353.13 | 1527.28 | 1217.2 | 959.31 | 257.88 | 301.08 | 104.45 | 196.63 | 9 | 559.4 | 3535.46 | 5087.53 |
| 2015:Q2 | 6277.1 | 71.11 | 150.12 | 392.14 | 163.62 | 555.92 | 2243.31 | 727.8 | 1452.3 | 63.2 | 169.72 | 118.96 | 50.76 | 1974.95 | 556.2 | 2725.15 | 713.89 | 375.88 | 338.02 | 1554.87 | 1263.15 | 980.11 | 283.04 | 279.78 | 130.41 | 149.37 | 11.94 | 456.38 | 3551.95 | 4668.83 |
| 2015:Q3 | 6191.98 | 68.33 | 170.8 | 394.34 | 162.35 | 566 | 2268.08 | 743.58 | 1458.71 | 65.79 | 164.77 | 110.28 | 54.5 | 1800.15 | 597.16 | 2744.57 | 794.55 | 418.25 | 376.3 | 1470.24 | 1181.88 | 915.65 | 266.23 | 275.69 | 125.74 | |||||
| 2015:Q4 | 6037.1 | 62 | 179.52 | 397.97 | 178.31 | 519.42 | 2133.7 | 701.37 | 1371.95 | 60.38 | 164.3 | 108.7 | 55.61 | 1830.64 | 571.23 | 2592.98 | 673.07 | 358.14 | 314.93 | 1468.26 | 1161.42 | 893.64 | 267.78 | 295.21 | 138.36 | 156.85 | 11.63 | 451.65 | 3444.12 | 4607.14 |
| 2016:Q1 | 6063.07 | 75.49 | 184.03 | 417.65 | 163.11 | 550.11 | 2228.16 | 754.83 | 1410.53 | 62.8 | 169.06 | 109.05 | 60.01 | 1726.54 | 548.92 | 2703.13 | 783.41 | 413.82 | 369.59 | 1431.35 | 1117.15 | 859.15 | 257.99 | 302.45 | 149.97 | 152.47 | 11.75 | 488.37 | 3359.94 | 5060.3 |
| 2016:Q2 | 6241.18 | 86.93 | 193.71 | 416.13 | 181.42 | 561.88 | 2401.83 | 868.14 | 1451.78 | 81.91 | 173.09 | 112.86 | 60.23 | 1695.33 | 530.87 | 2838.07 | 794.74 | 412.3 | 382.43 | 1450.79 | 1132.82 | 845.21 | 287.61 | 306.84 | 150.52 | 156.32 | 11.14 | 592.54 | 3403.12 | 5232.76 |
| 2016:Q3 | 6399.52 | 86.4 | 175.25 | 385.57 | 177.06 | 615.05 | 2366.65 | 870.68 | 1436.1 | 59.86 | 186.48 | 120.69 | 65.79 | 1821.18 | 585.88 | 2932.54 | 839.24 | 454.07 | 385.17 | 1571.97 | 1251.56 | 955.62 | 295.94 | 307.53 | 153.07 | 154.46 | 12.89 | 521.33 | 3466.98 | 5415.58 |
| 2016:Q4 | 6409.75 | 86.5 | 160.47 | 370.89 | 189.46 | 690.74 | 2265.77 | 797.48 | 1415.76 | 52.54 | 191.79 | 123.29 | 68.5 | 1824.79 | 629.32 | 2908.51 | 772.28 | 406.66 | 365.62 | 1611.6 | 1260.23 | 956.93 | 303.3 | 337.18 | 166.42 | 170.77 | 14.18 | 524.63 | 3501.24 | 5137.43 |
| 2017:Q1 | 6697.45 | 92.85 | 166.77 | 369.45 | 166.07 | 796.3 | 2365.72 | 810.56 | 1498.32 | 56.84 | 193.77 | 124.16 | 69.61 | 1962.41 | 584.11 | 3111.79 | 829.93 | 416.59 | 413.34 | 1728.44 | 1360.75 | 1033.86 | 326.9 | 351.24 | 161.21 | 190.02 | 16.46 | 553.41 | 3585.66 | 5620.49 |
| 2017:Q2 | 6823.72 | 94.87 | 169.4 | 371.9 | 173.19 | 829.59 | 2307.48 | 757.62 | 1482.97 | 66.89 | 213.4 | 145.01 | 68.39 | 2017.64 | 646.25 | 3175.92 | 879.79 | 445.01 | 434.78 | 1804.35 | 1425.45 | 1061.63 | 363.82 | 365.83 | 171.42 | 194.4 | 13.08 | 491.77 | 3647.8 | 5459.67 |
| 2017:Q3 | 7075.97 | 131.16 | 182.01 | 362.75 | 186.75 | 850.96 | 2387.17 | 778.01 | 1544.82 | 64.34 | 211.87 | 137.38 | 74.49 | 2130.55 | 632.75 | 3329.76 | 796.67 | 390.93 | 405.74 | 1940.41 | 1544.41 | 1152.22 | 392.18 | 381.73 | 176.55 | 205.18 | 14.27 | 592.68 | 3746.21 | 6013.04 |
| 2017:Q4 | 7177.63 | 105.78 | 161.84 | 358.91 | 195.63 | 822.45 | 2368.83 | 778.11 | 1526.55 | 64.18 | 220.86 | 142.62 | 78.25 | 2273.14 | 670.19 | 3296.33 | 762.95 | 377.33 | 385.62 | 1982.3 | 1569.19 | 1180.71 | 388.48 | 396.29 | 182.35 | 213.94 | 16.81 | 551.09 | 3881.3 | 6587.96 |
| 2018:Q1 | 7357.27 | 130.56 | 157.23 | 367.04 | 186.32 | 919.25 | 2476.53 | 748.26 | 1667.25 | 61.01 | 236.6 | 149.87 | 86.73 | 2256.9 | 626.85 | 3425.32 | 860.21 | 413.19 | 447.02 | 2053.04 | 1601.24 | 1211.66 | 389.58 | 435 | 195.67 | 239.34 | 16.79 | 512.07 | 3931.95 | 9668.54 |
| 2018:Q2 | 7590.1 | 127.64 | 148.34 | 383.77 | 183.29 | 878.57 | 2648.6 | 892.3 | 1685.53 | 70.77 | 247.36 | 149.93 | 97.43 | 2305.13 | 667.4 | 3612.22 | 987.87 | 530.78 | 457.08 | 2166.83 | 1717.03 | 1311.81 | 405.21 | 433.24 | 201.77 | 231.47 | 16.56 | 457.52 | 3977.88 | 8131.63 |
| 2018:Q3 | 7732.51 | 117.6 | 166.24 | 380.91 | 193.03 | 905.24 | 2725.16 | 958.96 | 1689.49 | 76.71 | 257.14 | 155.13 | 102.01 | 2330.08 | 657.11 | 3734.72 | 958.05 | 521.28 | 436.77 | 2229.86 | 1793.77 | 1349.55 | 444.23 | 421.18 | 208.14 | 213.04 | 14.91 | 546.81 | 3997.79 | 6539.58 |
| 2018:Q4 | 7487.33 | 114.04 | 167.23 | 376.76 | 223.67 | 925.26 | 2790.3 | 1078.62 | 1631.33 | 80.35 | 265.68 | 159.57 | 106.11 | 1979.44 | 644.96 | 3732.07 | 1208.02 | 689.66 | 518.36 | 1899.05 | 1454.03 | 1103.42 | 350.6 | 431.05 | 208.03 | 223.02 | 13.97 | 625 | 3755.26 | 6297.7 |
| 2019:Q1 | 7864.09 | 124.9 | 168.29 | 426.82 | 184.83 | 976.42 | 2955.63 | 1206.47 | 1680.01 | 69.15 | 289.06 | 172.95 | 116.11 | 2200.95 | 537.18 | 3951.55 | 1357.05 | 764.55 | 592.51 | 2055.28 | 1595.8 | 1221.71 | 374.09 | 444.66 | 223.96 | 220.7 | 14.82 | 539.22 | 3912.54 | 7381.33 |
| 2019:Q2 | 8100.68 | 124.68 | 164.23 | 434.17 | 183.95 | 867.77 | 3146.99 | 1364.23 | 1715.78 | 66.99 | 296.54 | 180.93 | 115.61 | 2262.74 | 619.61 | 4112.08 | 1429.06 | 803.19 | 625.86 | 2100.64 | 1609.25 | 1255.51 | 353.74 | 473.52 | 234.31 | 239.21 | 17.88 | 582.38 | 3988.6 | 7484.9 |
| 2019:Q3 | 7958.43 | 131.83 | 156.36 | 444.55 | 190.97 | 797.95 | 3068.11 | 1303.95 | 1697.46 | 66.69 | 293.09 | 187.08 | 106.01 | 2168.55 | 707.03 | 3976.09 | 1467.03 | 832.63 | 634.4 | 1973.45 | 1515.52 | 1199.48 | 316.05 | 439.81 | 208.8 | 231.02 | 18.12 | 535.61 | 3982.34 | 7525.74 |
| 2019:Q4 | 8113.09 | 129.28 | 151.84 | 452.97 | 205.22 | 837.1 | 3008.97 | 1226.57 | 1718.94 | 63.46 | 315.39 | 199.01 | 116.38 | 2378.44 | 633.87 | 4015.67 | 1440.39 | 798.94 | 641.45 | 2099.78 | 1584.59 | 1245.72 | 338.88 | 494.74 | 241.69 | 253.06 | 20.45 | 475.5 | 4097.42 | 7337.23 |
| 2020:Q1 | 7628.47 | 118.36 | 189.92 | 461.32 | 251.32 | 902.31 | 2960.11 | 1208.01 | 1690.18 | 61.92 | 308.33 | 201.88 | 106.45 | 1787.47 | 649.34 | 3913.47 | 1520.92 | 808.16 | 712.76 | 1716.69 | 1204.6 | 975.03 | 229.57 | 488.4 | 250.39 | 238.01 | 23.69 | 675.86 | 3715 | 6798.38 |
| 2020:Q2 | 7682.04 | 134.47 | 162.54 | 392.09 | 221.31 | 827.93 | 2819.79 | 988.99 | 1770.78 | 60.01 | 329.63 | 211.2 | 118.43 | 2141.37 | 652.93 | 3644.13 | 1273.67 | 672.49 | 601.18 | 1910.14 | 1443.83 | 1176.38 | 267.46 | 451.38 | 219.98 | 231.4 | 14.93 | 460.31 | 4037.91 | 6190.88 |
| 2020:Q3 | 8117.87 | 106.14 | 164.11 | 365.65 | 200.63 | 936.13 | 2981.16 | 1030.2 | 1889.07 | 61.89 | 359.52 | 233.27 | 126.25 | 2351.88 | 652.64 | 3861.1 | 1437.49 | 703.89 | 733.6 | 2060.34 | 1564.39 | 1282.54 | 281.85 | 481.39 | 210.88 | 270.5 | 14.56 | 363.27 | 4256.77 | 7643.41 |
| 2020:Q4 | 8465.89 | 122.96 | 162.29 | 384.13 | 201.47 | 874.81 | 2878.84 | 913.46 | 1903.87 | 61.51 | 356.2 | 234.78 | 121.42 | 2757.51 | 727.68 | 3965.76 | 1302.01 | 655.28 | 646.73 | 2244.66 | 1792.32 | 1475.44 | 316.88 | 436.6 | 213.1 | 223.49 | 15.74 | 419.09 | 4500.13 | 7653.64 |
| 2021:Q1 | 8557.82 | 130.87 | 168.94 | 430.53 | 205.06 | 1006.22 | 2629.75 | 813.52 | 1761.41 | 54.82 | 389.34 | 258.91 | 130.43 | 2898.36 | 698.75 | 3938.54 | 1151.13 | 576.73 | 574.4 | 2426.77 | 1889.83 | 1546.33 | 343.49 | 519.39 | 264.59 | 254.8 | 17.56 | 360.63 | 4619.28 | 8560.49 |
| 2021:Q2 | 9225.03 | 138.53 | 184.52 | 507.72 | 200.78 | 1122.86 | 2801.85 | 871.89 | 1879.07 | 50.88 | 399.86 | 266.19 | 133.67 | 3164.71 | 704.18 | 4284.45 | 1191.76 | 567.54 | 624.22 | 2724.53 | 2123.99 | 1774.41 | 349.57 | 581.73 | 293.65 | 288.08 | 18.81 | 368.16 | 4940.58 | 8881.29 |
| 2021:Q3 | 9617.96 | 167.24 | 206.53 | 455.28 | 209.29 | 1227.46 | 3044.11 | 965.09 | 2016.55 | 62.47 | 420.68 | 279.92 | 140.76 | 3069.39 | 817.98 | 4584.27 | 1284.34 | 599.57 | 684.77 | 2721.68 | 2101.39 | 1727.9 | 373.49 | 584.73 | 306.39 | 278.33 | 35.56 | 578.25 | 5033.69 | 8891.96 |
| 2021:Q4 | 9678.89 | 157.92 | 189.41 | 483.35 | 241.35 | 1251.58 | 2918.89 | 951.6 | 1908.63 | 58.66 | 445.19 | 296.67 | 148.52 | 3189.85 | 801.34 | 4574.54 | 1229.59 | 589.05 | 640.54 | 2878.38 | 2146.13 | 1766.88 | 379.24 | 678.9 | 358.4 | 320.5 | 53.35 | 466.58 | 5104.35 | 8542.37 |
| 2022:Q1 | 9974.14 | 172.36 | 187.36 | 697.24 | 240.1 | 1296.76 | 3078.6 | 1068.93 | 1955.58 | 54.08 | 472.09 | 319.34 | 152.75 | 3029.79 | 799.86 | 4565.89 | 1168.17 | 490.83 | 677.34 | 2711.84 | 2023.45 | 1697.72 | 325.73 | 645.25 | 328.92 | 316.33 | 43.13 | 685.88 | 5408.26 | 9217.8 |
| 2022:Q2 | 9283.37 | 186.15 | 176.34 | 481.99 | 266.3 | 1228.68 | 3027.93 | 1134.42 | 1838.67 | 54.85 | 480.44 | 320.29 | 160.15 | 2540.71 | 894.83 | 4506.87 | 1233.35 | 537.43 | 695.92 | 2503.04 | 1829.5 | 1546.22 | 283.28 | 636.43 | 353.15 | 283.27 | 37.11 | 770.48 | 4776.5 | 7905.95 |
| 2022:Q3 | 9079.39 | 162.14 | 165.89 | 476.7 | 256.18 | 1160.66 | 3072.32 | 1086.91 | 1931.6 | 53.81 | 481.66 | 323.31 | 158.35 | 2444.94 | 858.9 | 4377.01 | 1233.29 | 550.02 | 683.27 | 2413.51 | 1757.71 | 1488.78 | 268.93 | 615.95 | 394.54 | 221.41 | 39.85 | 730.21 | 4702.37 | 7933.63 |
| 2022:Q4 | 9107.08 | 172.98 | 179.04 | 484.44 | 248.73 | 1103.65 | 3080.58 | 1095.51 | 1924.71 | 60.36 | 495.36 | 335.27 | 160.09 | 2519.74 | 822.57 | 4431.14 | 1241.39 | 588.74 | 652.66 | 2432.76 | 1755.5 | 1439.01 | 316.49 | 634.42 | 484.52 | 149.9 | 42.84 | 756.99 | 4675.94 | 7936.64 |
| 2023:Q1 | 9381.54 | 159.09 | 228.54 | 467.67 | 217.45 | 1186.12 | 3160.01 | 1198.64 | 1908.85 | 52.51 | 515.88 | 354.01 | 161.87 | 2595.61 | 851.17 | 4597.25 | 1528.12 | 745.67 | 782.45 | 2547.28 | 1891.67 | 1532.26 | 359.41 | 613.53 | 452.25 | 161.27 | 42.09 | 521.85 | 4784.29 | 8291.55 |
Source: https://www.federalreserve.gov/releases/efa/all_hedge_funds_balance_sheet.csv

- The Fed's Enhanced Financial Accounts (EFAs) on Hedge Funds: Hedge Fund liabilities hit new all time high in 2023:Q1.
- Hedge Fund exposure from derivatives grew 4.47% or $354.91 Billion from 2022:Q4 to 2023:Q1
- Leveraged Loans hit a new all-time high.
- Security repurchase agreements also hit an all-time high
This is really starting to look like a powder keg getting ready to blow!

TLDRS:
- NSCC provided notice to its Members to inform them of the definite implementation and effective date of the new VaR charge October 2, 2023.
- Remember VaR tinkers with the mechanics that would have defaulted Robinhood, Instinet, & Others 1/28/21.
- The approved rule aims to address the potential increased idiosyncratic risks NSCC might face, especially regarding the liquidation of a risky portfolio during a member default.
- Enhances NSCC's ability to recognize and produce margins that match the idiosyncratic risks and attributes of portfolios that meet the concentration threshold.
- Broadening the gap risk charge to an additive feature and focusing on the two largest non-diversified positions will help NSCC better manage the idiosyncratic risks tied to concentrated portfolios.
- Given the additive nature of the gap risk charge, the Commission agrees that the adjustments to its calculation, like establishing floors for gap risk haircuts for the two largest positions, are aptly designed to handle NSCC’s idiosyncratic risks exposure during member defaults.
- Introducing specific criteria to determine which securities fall under the gap risk charge will enable NSCC to pinpoint those more prone to idiosyncratic risks, ensuring ETFs identified as non-diversified are included.
- Robinhood, Instinet, & Other Brokers Would Have Defaulted January 28, 2021 - The NSCC, as an enabler, saved them, while sacrificing retail, in allowing them to alter their margin charges by freezing stock buying - top priority: protecting too-big-to-fail clearinghouse - Retail's fault the NSCC didn't prepare
- The changes should lead to higher margin requirements for those with short positions in volatile stocks like GameStop. The higher the costs, the more pressure on short sellers to close their positions, especially if they face liquidity challenges.
- If short sellers can't meet their margin requirements, they'll be forced to buy back the shares to close their positions, leading to a surge in demand and subsequently, a rise in share price.
- As the stock price rises due to forced buybacks, other short sellers face further margin calls, creating a snowball effect where more short sellers are forced to buy back shares, pushing the price up even further until lift off...
- Haircuts are also in the process of being tweaked.
- MOASS Prediction: anytime after 10/2.
- This prediction is not financial advice or advocating for a specific date in anyway, only an attempt to read tea leaves based on implementation dates and prior happenings.