August was the 15th consecutive month of net outflows for the hedge fund industry. Investors removed an estimated net $6.10 billion from hedge funds in August. Since 1/1/2022, Investors have removed $169.68 billion from hedge funds.

Hello, I hope your Tuesday is off to a great start! A quick fun fact before getting started: October 24th is the anniversary of the first transcontinental telegraph (completed October 24, 1861).
The inaugural message going 'coast to coast' for the first time was from Stephen J. Field (Chief Justice of California's Supreme Court) in Sacramento California to President Abraham Lincoln in Washington D.C. congratulating the President on the achievement and pledging California's support to the Union.
Sent at 7:40 PM on October 24, the President received this message by 11:30 AM the next day--a technological marvel. During the 1860s, it was the sole means of almost immediate communication between the eastern and western shores. To try and put this in perspective, in 1841, it took 110 days for the news of President William Henry Harrison's passing to get to Los Angeles.
Why do I bring this up? Well, it has been just over a month since the launch of this place and I am stoked with how this small hub of information has linked up with the broader network of GameStop information and that folks are choosing to make this a stop along their daily commute of traversing the information super railway!
Thank you for humoring me and now on to the post!
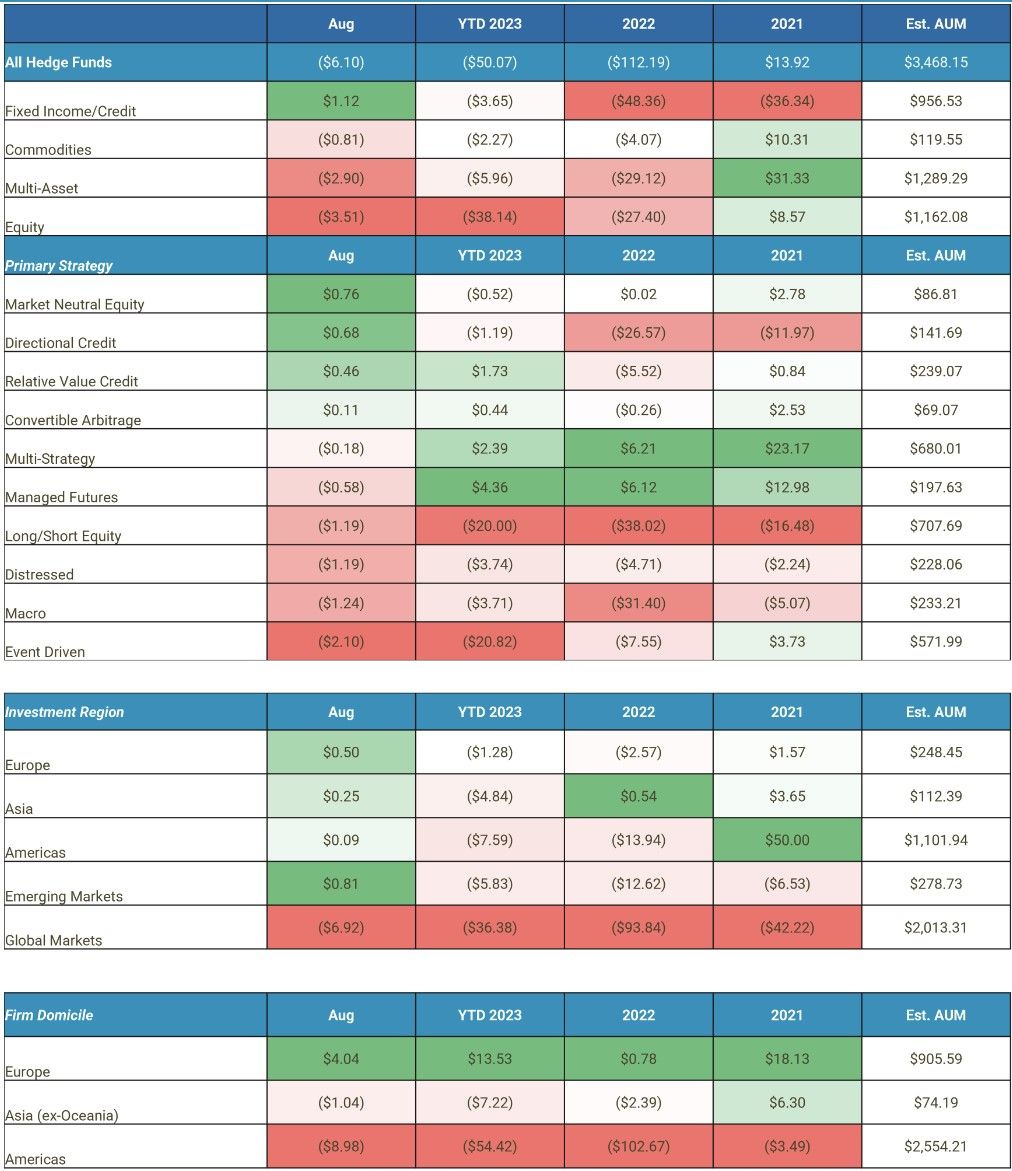
Investors removed an estimated net $6.10 billion from hedge funds in August. Performance accounted for a slight increase in assets. The result of both factors was a $5.8 billion increase in assets under management to an estimated $3.468 trillion.
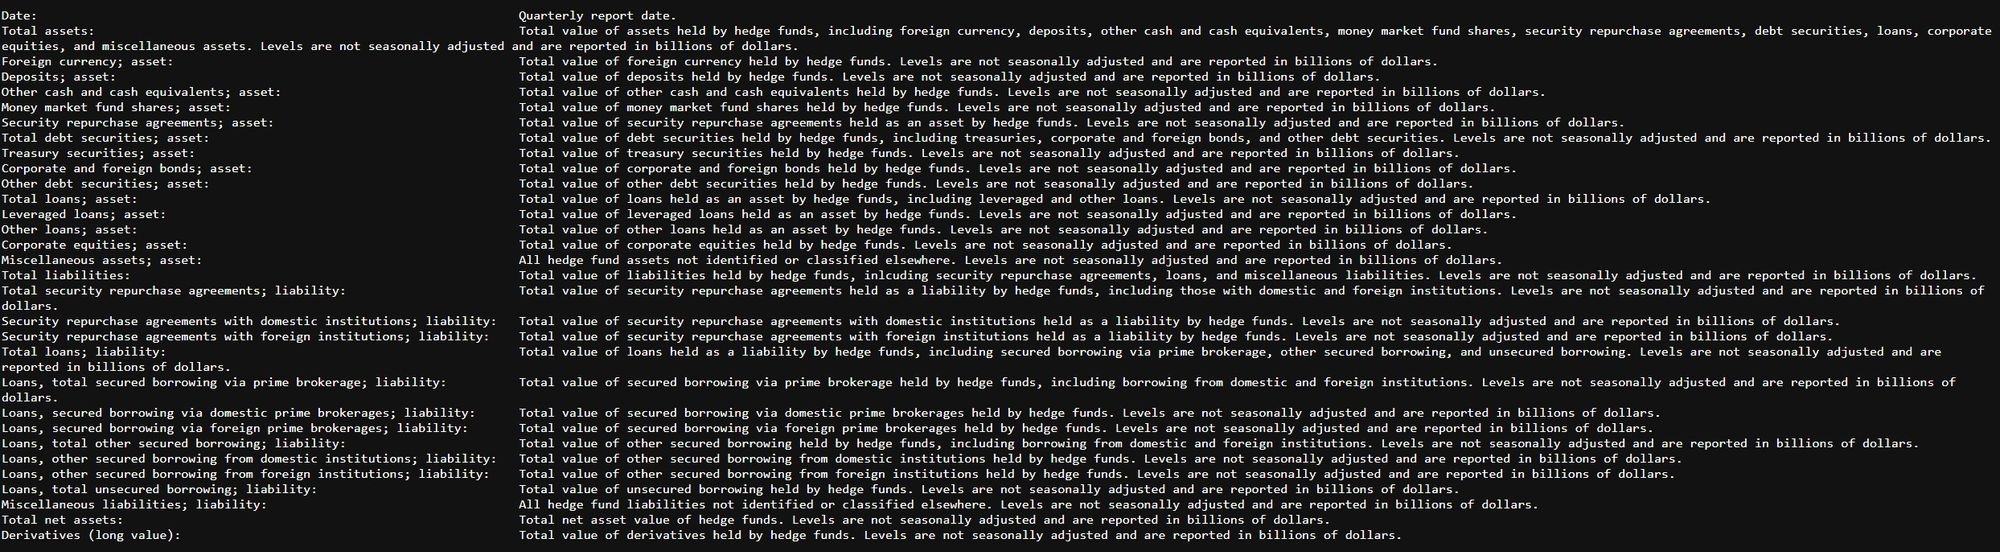
Recall from the Fed's Enhanced Financial Accounts (EFAs) on Hedge Funds:
Hedge Fund liabilities hit new all time high in 2023:Q1
- This table shows the aggregate assets and liabilities of hedge funds that file Form PF with the Securities and Exchange Commission.
- Unlike table B.101.f in the regular Financial Accounts publication, which reports assets and liabilities of domestic hedge funds only, this table presents data on all hedge funds that file Form PF, both domestic and foreign.
- The first part of the table reports the long position for the respective asset categories, with derivative exposure being excluded.
- The second part of the table reports the liability items, which detail the source of borrowing. A memo item reports total long derivative exposure.
| Date | Total assets | Foreign currency; asset | Deposits; asset | Other cash and cash equivalents; asset | Money market fund shares; asset | Security repurchase agreements; asset | Total debt securities; asset | Treasury securities; asset | Corporate and foreign bonds; asset | Other debt securities; asset | Total loans; asset | Leveraged loans; asset | Other loans; asset | Corporate equities; asset | Miscellaneous assets; asset | Total liabilities | Total security repurchase agreements; liability | Security repurchase agreements with domestic institutions; liability | Security repurchase agreements with foreign institutions; liability | Total loans; liability | Loans, total secured borrowing via prime brokerage; liability | Loans, secured borrowing via domestic prime brokerages ; liability | Loans, secured borrowing via foreign prime brokerages; liability | Loans, total other secured borrowing; liability | Loans, other secured borrowing from domestic institutions; liability | Loans, other secured borrowing from foreign institutions; liability | Loans, total unsecured borrowing; liability | Miscellaneous liabilities; liability | Total net assets | Derivatives (long value) |
|---|---|---|---|---|---|---|---|---|---|---|---|---|---|---|---|---|---|---|---|---|---|---|---|---|---|---|---|---|---|---|
| 2012:Q4 | 4254.22 | 51.97 | 116.9 | 309.04 | 74.9 | 347.61 | 1708.78 | 654.49 | 993.65 | 60.64 | 133.35 | 108.84 | 24.5 | 1148.48 | 363.19 | 1834.19 | 602.76 | 294.72 | 308.04 | 976.64 | 764.23 | 599.9 | 164.34 | 209.83 | 139.66 | 70.18 | 2.58 | 254.78 | 2420.03 | 8311.76 |
| 2013:Q1 | 4729.57 | 75.49 | 105.4 | 294.93 | 76.49 | 412.56 | 1942.94 | 755.22 | 1135.35 | 52.37 | 136.65 | 110.5 | 26.15 | 1292.39 | 392.73 | 2137.6 | 657.58 | 306.58 | 350.99 | 1153.52 | 906.42 | 715.64 | 190.78 | 243.46 | 126.91 | 116.56 | 3.64 | 326.5 | 2591.97 | 5900.76 |
| 2013:Q2 | 4851.63 | 71.39 | 116.99 | 320.31 | 77.14 | 543.69 | 1884.14 | 664.32 | 1134.43 | 85.39 | 140.48 | 107.03 | 33.45 | 1332.26 | 365.23 | 2217.88 | 779.15 | 404.36 | 374.79 | 1205.52 | 948.27 | 714.11 | 234.16 | 251.49 | 118.5 | 132.99 | 5.76 | 233.21 | 2633.75 | 4844.51 |
| 2013:Q3 | 4998.9 | 70.3 | 125.02 | 336.5 | 85.55 | 508.26 | 1901.87 | 673.41 | 1171.91 | 56.56 | 143.17 | 108.38 | 34.79 | 1424.21 | 404.02 | 2248.64 | 668.15 | 327.45 | 340.7 | 1252.65 | 958.63 | 759.94 | 198.69 | 286.63 | 142.36 | 144.27 | 7.39 | 327.84 | 2750.26 | 4930.88 |
| 2013:Q4 | 5351.05 | 70.85 | 134.01 | 381.27 | 126.79 | 474.71 | 1930.15 | 657.51 | 1229.22 | 43.42 | 149.23 | 102.68 | 46.55 | 1618.21 | 465.82 | 2294.94 | 579.54 | 290.07 | 289.47 | 1392.8 | 1083.19 | 862.97 | 220.22 | 301.88 | 144.85 | 157.04 | 7.73 | 322.6 | 3056.11 | 5253.12 |
| 2014:Q1 | 5544.42 | 82.19 | 146.01 | 386.11 | 128.38 | 566.71 | 1987.79 | 679 | 1261.15 | 47.65 | 154.05 | 110.86 | 43.19 | 1661.02 | 432.17 | 2437.48 | 558.01 | 257.69 | 300.32 | 1461.47 | 1139.93 | 910.72 | 229.21 | 310.31 | 124.12 | 186.19 | 11.24 | 418 | 3106.94 | 5260.63 |
| 2014:Q2 | 5778.15 | 78.68 | 154.67 | 398.53 | 139.37 | 572.34 | 2046.01 | 623.27 | 1360.17 | 62.57 | 161.68 | 113.64 | 48.04 | 1775.19 | 451.68 | 2511.18 | 605.29 | 275.4 | 329.89 | 1433.12 | 1123.5 | 876.48 | 247.02 | 296.67 | 106.49 | 190.18 | 12.94 | 472.77 | 3266.97 | 5166.33 |
| 2014:Q3 | 5883.62 | 86.13 | 153.11 | 421.41 | 132.19 | 617.16 | 2131.29 | 710.54 | 1351.63 | 69.11 | 160.51 | 113.41 | 47.1 | 1742.82 | 439 | 2641.73 | 635.54 | 293.52 | 342.02 | 1441.53 | 1114.58 | 847.2 | 267.38 | 314.08 | 121.19 | 192.89 | 12.87 | 564.66 | 3241.88 | 5305.47 |
| 2014:Q4 | 5925.22 | 77.59 | 161.87 | 426.46 | 166.37 | 553.59 | 2058.62 | 659.94 | 1334.33 | 64.35 | 168.14 | 116.34 | 51.81 | 1809.85 | 502.72 | 2564.85 | 614.55 | 302.28 | 312.27 | 1486.4 | 1168.91 | 896.95 | 271.97 | 307.43 | 122.59 | 184.85 | 10.05 | 463.9 | 3360.36 | 4654.88 |
| 2015:Q1 | 6350.43 | 91.42 | 162.73 | 398.79 | 159.67 | 583.07 | 2337.87 | 754.92 | 1516.57 | 66.39 | 167.34 | 116.63 | 50.71 | 1887.13 | 562.41 | 2814.97 | 728.29 | 375.16 | 353.13 | 1527.28 | 1217.2 | 959.31 | 257.88 | 301.08 | 104.45 | 196.63 | 9 | 559.4 | 3535.46 | 5087.53 |
| 2015:Q2 | 6277.1 | 71.11 | 150.12 | 392.14 | 163.62 | 555.92 | 2243.31 | 727.8 | 1452.3 | 63.2 | 169.72 | 118.96 | 50.76 | 1974.95 | 556.2 | 2725.15 | 713.89 | 375.88 | 338.02 | 1554.87 | 1263.15 | 980.11 | 283.04 | 279.78 | 130.41 | 149.37 | 11.94 | 456.38 | 3551.95 | 4668.83 |
| 2015:Q3 | 6191.98 | 68.33 | 170.8 | 394.34 | 162.35 | 566 | 2268.08 | 743.58 | 1458.71 | 65.79 | 164.77 | 110.28 | 54.5 | 1800.15 | 597.16 | 2744.57 | 794.55 | 418.25 | 376.3 | 1470.24 | 1181.88 | 915.65 | 266.23 | 275.69 | 125.74 | |||||
| 2015:Q4 | 6037.1 | 62 | 179.52 | 397.97 | 178.31 | 519.42 | 2133.7 | 701.37 | 1371.95 | 60.38 | 164.3 | 108.7 | 55.61 | 1830.64 | 571.23 | 2592.98 | 673.07 | 358.14 | 314.93 | 1468.26 | 1161.42 | 893.64 | 267.78 | 295.21 | 138.36 | 156.85 | 11.63 | 451.65 | 3444.12 | 4607.14 |
| 2016:Q1 | 6063.07 | 75.49 | 184.03 | 417.65 | 163.11 | 550.11 | 2228.16 | 754.83 | 1410.53 | 62.8 | 169.06 | 109.05 | 60.01 | 1726.54 | 548.92 | 2703.13 | 783.41 | 413.82 | 369.59 | 1431.35 | 1117.15 | 859.15 | 257.99 | 302.45 | 149.97 | 152.47 | 11.75 | 488.37 | 3359.94 | 5060.3 |
| 2016:Q2 | 6241.18 | 86.93 | 193.71 | 416.13 | 181.42 | 561.88 | 2401.83 | 868.14 | 1451.78 | 81.91 | 173.09 | 112.86 | 60.23 | 1695.33 | 530.87 | 2838.07 | 794.74 | 412.3 | 382.43 | 1450.79 | 1132.82 | 845.21 | 287.61 | 306.84 | 150.52 | 156.32 | 11.14 | 592.54 | 3403.12 | 5232.76 |
| 2016:Q3 | 6399.52 | 86.4 | 175.25 | 385.57 | 177.06 | 615.05 | 2366.65 | 870.68 | 1436.1 | 59.86 | 186.48 | 120.69 | 65.79 | 1821.18 | 585.88 | 2932.54 | 839.24 | 454.07 | 385.17 | 1571.97 | 1251.56 | 955.62 | 295.94 | 307.53 | 153.07 | 154.46 | 12.89 | 521.33 | 3466.98 | 5415.58 |
| 2016:Q4 | 6409.75 | 86.5 | 160.47 | 370.89 | 189.46 | 690.74 | 2265.77 | 797.48 | 1415.76 | 52.54 | 191.79 | 123.29 | 68.5 | 1824.79 | 629.32 | 2908.51 | 772.28 | 406.66 | 365.62 | 1611.6 | 1260.23 | 956.93 | 303.3 | 337.18 | 166.42 | 170.77 | 14.18 | 524.63 | 3501.24 | 5137.43 |
| 2017:Q1 | 6697.45 | 92.85 | 166.77 | 369.45 | 166.07 | 796.3 | 2365.72 | 810.56 | 1498.32 | 56.84 | 193.77 | 124.16 | 69.61 | 1962.41 | 584.11 | 3111.79 | 829.93 | 416.59 | 413.34 | 1728.44 | 1360.75 | 1033.86 | 326.9 | 351.24 | 161.21 | 190.02 | 16.46 | 553.41 | 3585.66 | 5620.49 |
| 2017:Q2 | 6823.72 | 94.87 | 169.4 | 371.9 | 173.19 | 829.59 | 2307.48 | 757.62 | 1482.97 | 66.89 | 213.4 | 145.01 | 68.39 | 2017.64 | 646.25 | 3175.92 | 879.79 | 445.01 | 434.78 | 1804.35 | 1425.45 | 1061.63 | 363.82 | 365.83 | 171.42 | 194.4 | 13.08 | 491.77 | 3647.8 | 5459.67 |
| 2017:Q3 | 7075.97 | 131.16 | 182.01 | 362.75 | 186.75 | 850.96 | 2387.17 | 778.01 | 1544.82 | 64.34 | 211.87 | 137.38 | 74.49 | 2130.55 | 632.75 | 3329.76 | 796.67 | 390.93 | 405.74 | 1940.41 | 1544.41 | 1152.22 | 392.18 | 381.73 | 176.55 | 205.18 | 14.27 | 592.68 | 3746.21 | 6013.04 |
| 2017:Q4 | 7177.63 | 105.78 | 161.84 | 358.91 | 195.63 | 822.45 | 2368.83 | 778.11 | 1526.55 | 64.18 | 220.86 | 142.62 | 78.25 | 2273.14 | 670.19 | 3296.33 | 762.95 | 377.33 | 385.62 | 1982.3 | 1569.19 | 1180.71 | 388.48 | 396.29 | 182.35 | 213.94 | 16.81 | 551.09 | 3881.3 | 6587.96 |
| 2018:Q1 | 7357.27 | 130.56 | 157.23 | 367.04 | 186.32 | 919.25 | 2476.53 | 748.26 | 1667.25 | 61.01 | 236.6 | 149.87 | 86.73 | 2256.9 | 626.85 | 3425.32 | 860.21 | 413.19 | 447.02 | 2053.04 | 1601.24 | 1211.66 | 389.58 | 435 | 195.67 | 239.34 | 16.79 | 512.07 | 3931.95 | 9668.54 |
| 2018:Q2 | 7590.1 | 127.64 | 148.34 | 383.77 | 183.29 | 878.57 | 2648.6 | 892.3 | 1685.53 | 70.77 | 247.36 | 149.93 | 97.43 | 2305.13 | 667.4 | 3612.22 | 987.87 | 530.78 | 457.08 | 2166.83 | 1717.03 | 1311.81 | 405.21 | 433.24 | 201.77 | 231.47 | 16.56 | 457.52 | 3977.88 | 8131.63 |
| 2018:Q3 | 7732.51 | 117.6 | 166.24 | 380.91 | 193.03 | 905.24 | 2725.16 | 958.96 | 1689.49 | 76.71 | 257.14 | 155.13 | 102.01 | 2330.08 | 657.11 | 3734.72 | 958.05 | 521.28 | 436.77 | 2229.86 | 1793.77 | 1349.55 | 444.23 | 421.18 | 208.14 | 213.04 | 14.91 | 546.81 | 3997.79 | 6539.58 |
| 2018:Q4 | 7487.33 | 114.04 | 167.23 | 376.76 | 223.67 | 925.26 | 2790.3 | 1078.62 | 1631.33 | 80.35 | 265.68 | 159.57 | 106.11 | 1979.44 | 644.96 | 3732.07 | 1208.02 | 689.66 | 518.36 | 1899.05 | 1454.03 | 1103.42 | 350.6 | 431.05 | 208.03 | 223.02 | 13.97 | 625 | 3755.26 | 6297.7 |
| 2019:Q1 | 7864.09 | 124.9 | 168.29 | 426.82 | 184.83 | 976.42 | 2955.63 | 1206.47 | 1680.01 | 69.15 | 289.06 | 172.95 | 116.11 | 2200.95 | 537.18 | 3951.55 | 1357.05 | 764.55 | 592.51 | 2055.28 | 1595.8 | 1221.71 | 374.09 | 444.66 | 223.96 | 220.7 | 14.82 | 539.22 | 3912.54 | 7381.33 |
| 2019:Q2 | 8100.68 | 124.68 | 164.23 | 434.17 | 183.95 | 867.77 | 3146.99 | 1364.23 | 1715.78 | 66.99 | 296.54 | 180.93 | 115.61 | 2262.74 | 619.61 | 4112.08 | 1429.06 | 803.19 | 625.86 | 2100.64 | 1609.25 | 1255.51 | 353.74 | 473.52 | 234.31 | 239.21 | 17.88 | 582.38 | 3988.6 | 7484.9 |
| 2019:Q3 | 7958.43 | 131.83 | 156.36 | 444.55 | 190.97 | 797.95 | 3068.11 | 1303.95 | 1697.46 | 66.69 | 293.09 | 187.08 | 106.01 | 2168.55 | 707.03 | 3976.09 | 1467.03 | 832.63 | 634.4 | 1973.45 | 1515.52 | 1199.48 | 316.05 | 439.81 | 208.8 | 231.02 | 18.12 | 535.61 | 3982.34 | 7525.74 |
| 2019:Q4 | 8113.09 | 129.28 | 151.84 | 452.97 | 205.22 | 837.1 | 3008.97 | 1226.57 | 1718.94 | 63.46 | 315.39 | 199.01 | 116.38 | 2378.44 | 633.87 | 4015.67 | 1440.39 | 798.94 | 641.45 | 2099.78 | 1584.59 | 1245.72 | 338.88 | 494.74 | 241.69 | 253.06 | 20.45 | 475.5 | 4097.42 | 7337.23 |
| 2020:Q1 | 7628.47 | 118.36 | 189.92 | 461.32 | 251.32 | 902.31 | 2960.11 | 1208.01 | 1690.18 | 61.92 | 308.33 | 201.88 | 106.45 | 1787.47 | 649.34 | 3913.47 | 1520.92 | 808.16 | 712.76 | 1716.69 | 1204.6 | 975.03 | 229.57 | 488.4 | 250.39 | 238.01 | 23.69 | 675.86 | 3715 | 6798.38 |
| 2020:Q2 | 7682.04 | 134.47 | 162.54 | 392.09 | 221.31 | 827.93 | 2819.79 | 988.99 | 1770.78 | 60.01 | 329.63 | 211.2 | 118.43 | 2141.37 | 652.93 | 3644.13 | 1273.67 | 672.49 | 601.18 | 1910.14 | 1443.83 | 1176.38 | 267.46 | 451.38 | 219.98 | 231.4 | 14.93 | 460.31 | 4037.91 | 6190.88 |
| 2020:Q3 | 8117.87 | 106.14 | 164.11 | 365.65 | 200.63 | 936.13 | 2981.16 | 1030.2 | 1889.07 | 61.89 | 359.52 | 233.27 | 126.25 | 2351.88 | 652.64 | 3861.1 | 1437.49 | 703.89 | 733.6 | 2060.34 | 1564.39 | 1282.54 | 281.85 | 481.39 | 210.88 | 270.5 | 14.56 | 363.27 | 4256.77 | 7643.41 |
| 2020:Q4 | 8465.89 | 122.96 | 162.29 | 384.13 | 201.47 | 874.81 | 2878.84 | 913.46 | 1903.87 | 61.51 | 356.2 | 234.78 | 121.42 | 2757.51 | 727.68 | 3965.76 | 1302.01 | 655.28 | 646.73 | 2244.66 | 1792.32 | 1475.44 | 316.88 | 436.6 | 213.1 | 223.49 | 15.74 | 419.09 | 4500.13 | 7653.64 |
| 2021:Q1 | 8557.82 | 130.87 | 168.94 | 430.53 | 205.06 | 1006.22 | 2629.75 | 813.52 | 1761.41 | 54.82 | 389.34 | 258.91 | 130.43 | 2898.36 | 698.75 | 3938.54 | 1151.13 | 576.73 | 574.4 | 2426.77 | 1889.83 | 1546.33 | 343.49 | 519.39 | 264.59 | 254.8 | 17.56 | 360.63 | 4619.28 | 8560.49 |
| 2021:Q2 | 9225.03 | 138.53 | 184.52 | 507.72 | 200.78 | 1122.86 | 2801.85 | 871.89 | 1879.07 | 50.88 | 399.86 | 266.19 | 133.67 | 3164.71 | 704.18 | 4284.45 | 1191.76 | 567.54 | 624.22 | 2724.53 | 2123.99 | 1774.41 | 349.57 | 581.73 | 293.65 | 288.08 | 18.81 | 368.16 | 4940.58 | 8881.29 |
| 2021:Q3 | 9617.96 | 167.24 | 206.53 | 455.28 | 209.29 | 1227.46 | 3044.11 | 965.09 | 2016.55 | 62.47 | 420.68 | 279.92 | 140.76 | 3069.39 | 817.98 | 4584.27 | 1284.34 | 599.57 | 684.77 | 2721.68 | 2101.39 | 1727.9 | 373.49 | 584.73 | 306.39 | 278.33 | 35.56 | 578.25 | 5033.69 | 8891.96 |
| 2021:Q4 | 9678.89 | 157.92 | 189.41 | 483.35 | 241.35 | 1251.58 | 2918.89 | 951.6 | 1908.63 | 58.66 | 445.19 | 296.67 | 148.52 | 3189.85 | 801.34 | 4574.54 | 1229.59 | 589.05 | 640.54 | 2878.38 | 2146.13 | 1766.88 | 379.24 | 678.9 | 358.4 | 320.5 | 53.35 | 466.58 | 5104.35 | 8542.37 |
| 2022:Q1 | 9974.14 | 172.36 | 187.36 | 697.24 | 240.1 | 1296.76 | 3078.6 | 1068.93 | 1955.58 | 54.08 | 472.09 | 319.34 | 152.75 | 3029.79 | 799.86 | 4565.89 | 1168.17 | 490.83 | 677.34 | 2711.84 | 2023.45 | 1697.72 | 325.73 | 645.25 | 328.92 | 316.33 | 43.13 | 685.88 | 5408.26 | 9217.8 |
| 2022:Q2 | 9283.37 | 186.15 | 176.34 | 481.99 | 266.3 | 1228.68 | 3027.93 | 1134.42 | 1838.67 | 54.85 | 480.44 | 320.29 | 160.15 | 2540.71 | 894.83 | 4506.87 | 1233.35 | 537.43 | 695.92 | 2503.04 | 1829.5 | 1546.22 | 283.28 | 636.43 | 353.15 | 283.27 | 37.11 | 770.48 | 4776.5 | 7905.95 |
| 2022:Q3 | 9079.39 | 162.14 | 165.89 | 476.7 | 256.18 | 1160.66 | 3072.32 | 1086.91 | 1931.6 | 53.81 | 481.66 | 323.31 | 158.35 | 2444.94 | 858.9 | 4377.01 | 1233.29 | 550.02 | 683.27 | 2413.51 | 1757.71 | 1488.78 | 268.93 | 615.95 | 394.54 | 221.41 | 39.85 | 730.21 | 4702.37 | 7933.63 |
| 2022:Q4 | 9107.08 | 172.98 | 179.04 | 484.44 | 248.73 | 1103.65 | 3080.58 | 1095.51 | 1924.71 | 60.36 | 495.36 | 335.27 | 160.09 | 2519.74 | 822.57 | 4431.14 | 1241.39 | 588.74 | 652.66 | 2432.76 | 1755.5 | 1439.01 | 316.49 | 634.42 | 484.52 | 149.9 | 42.84 | 756.99 | 4675.94 | 7936.64 |
| 2023:Q1 | 9381.54 | 159.09 | 228.54 | 467.67 | 217.45 | 1186.12 | 3160.01 | 1198.64 | 1908.85 | 52.51 | 515.88 | 354.01 | 161.87 | 2595.61 | 851.17 | 4597.25 | 1528.12 | 745.67 | 782.45 | 2547.28 | 1891.67 | 1532.26 | 359.41 | 613.53 | 452.25 | 161.27 | 42.09 | 521.85 | 4784.29 | 8291.55 |
Source: https://www.federalreserve.gov/releases/efa/all_hedge_funds_balance_sheet.csv
The Fed's Enhanced Financial Accounts (EFAs) on Hedge Funds:
- Hedge Fund liabilities hit new all time high in 2023:Q1.
- Hedge Fund exposure from derivatives grew 4.47% or $354.91 Billion from 2022:Q4 to 2023:Q1
- Leveraged Loans hit a new all-time high.
- Security repurchase agreements also hit an all-time high.
"We also note that, since the data ending date of May 9th, 2023, when this note was drafted, hedge fund short futures positions have continued to rise"
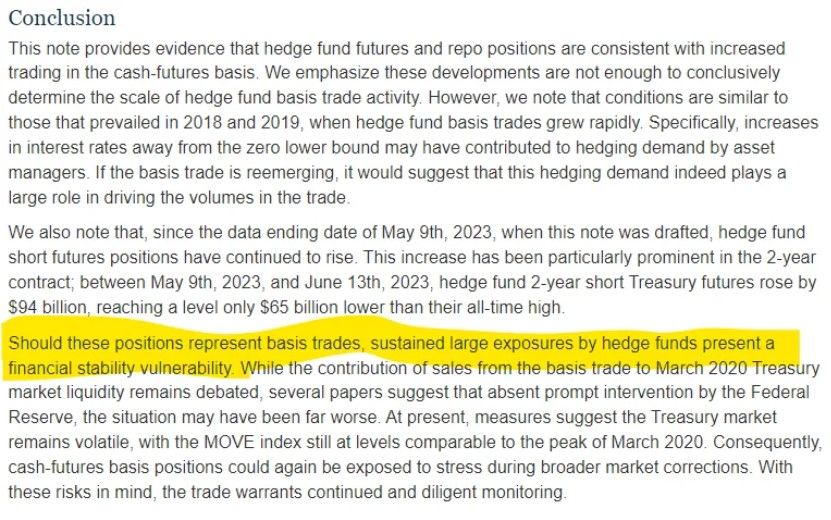
"Should these positions represent basis trades, sustained large exposures by hedge funds present a financial stability vulnerability"


TLDRS:
- August was the 15th consecutive month of net outflows for the hedge fund industry.
- Investors removed an estimated net $6.10 billion from hedge funds in August.
- Investors removed an estimated net $5.6 billion from hedge funds in July.
- June 2023 witnessed the 13th straight month of net outflows in the hedge fund industry, with an estimated net $13.12 billion taken out.
- May marked the 12th consecutive monthly net outflow for the hedge fund industry and was also the largest net outflow for the month of May since at least 2009.
- Investors removed an estimated net $9.96 billion from hedge funds in May.
- Investors pulled $11.57 billion out of hedge funds in April
- Investors removed an estimated net $3.32 billion from hedge funds in March.
- Investors removed an estimated net $4.83 billion from hedge funds in February.
- Investors removed an estimated net $4.18 billion from hedge funds in January.
- Investors removed an estimated net $111 billion from hedge funds in 2022.
- From 1/1/2022-8/31/23, Investors have removed $169.68 billion from hedge funds.
- Hedge Fund liabilities hit new all time high in 2023:Q1.
- Hedge Fund exposure from derivatives grew 4.47% or $354.91 Billion from 2022:Q4 to 2023:Q1
- Leveraged Loans hit a new all-time high.
- Security repurchase agreements also hit an all-time high.
- "We also note that, since the data ending date of May 9th, 2023, when this note was drafted, hedge fund short futures positions have continued to rise"
- "Should these positions represent basis trades, sustained large exposures by hedge funds present a financial stability vulnerability".