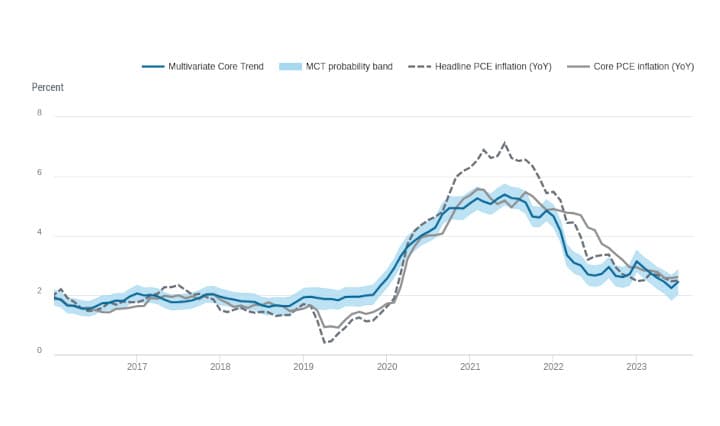
Fed's Jefferson on core nonhousing services inflation: "Since this segment accounts for more than 50% of the overall core PCE index, we will need to see further slowing in this area to meet our inflation objective."

The Inflation Outlook:
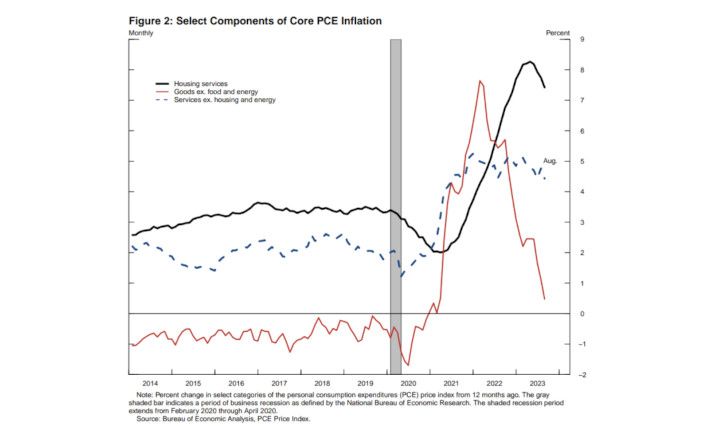
- "Even though recent inflation data have been encouraging, inflation remains too high. Over the 12 months ending in August, total Personal Consumption Expenditures (PCE) prices rose 3.5 percent, the black line in figure 1. Excluding the volatile food and energy categories, core PCE prices rose 3.9 percent, the red line."
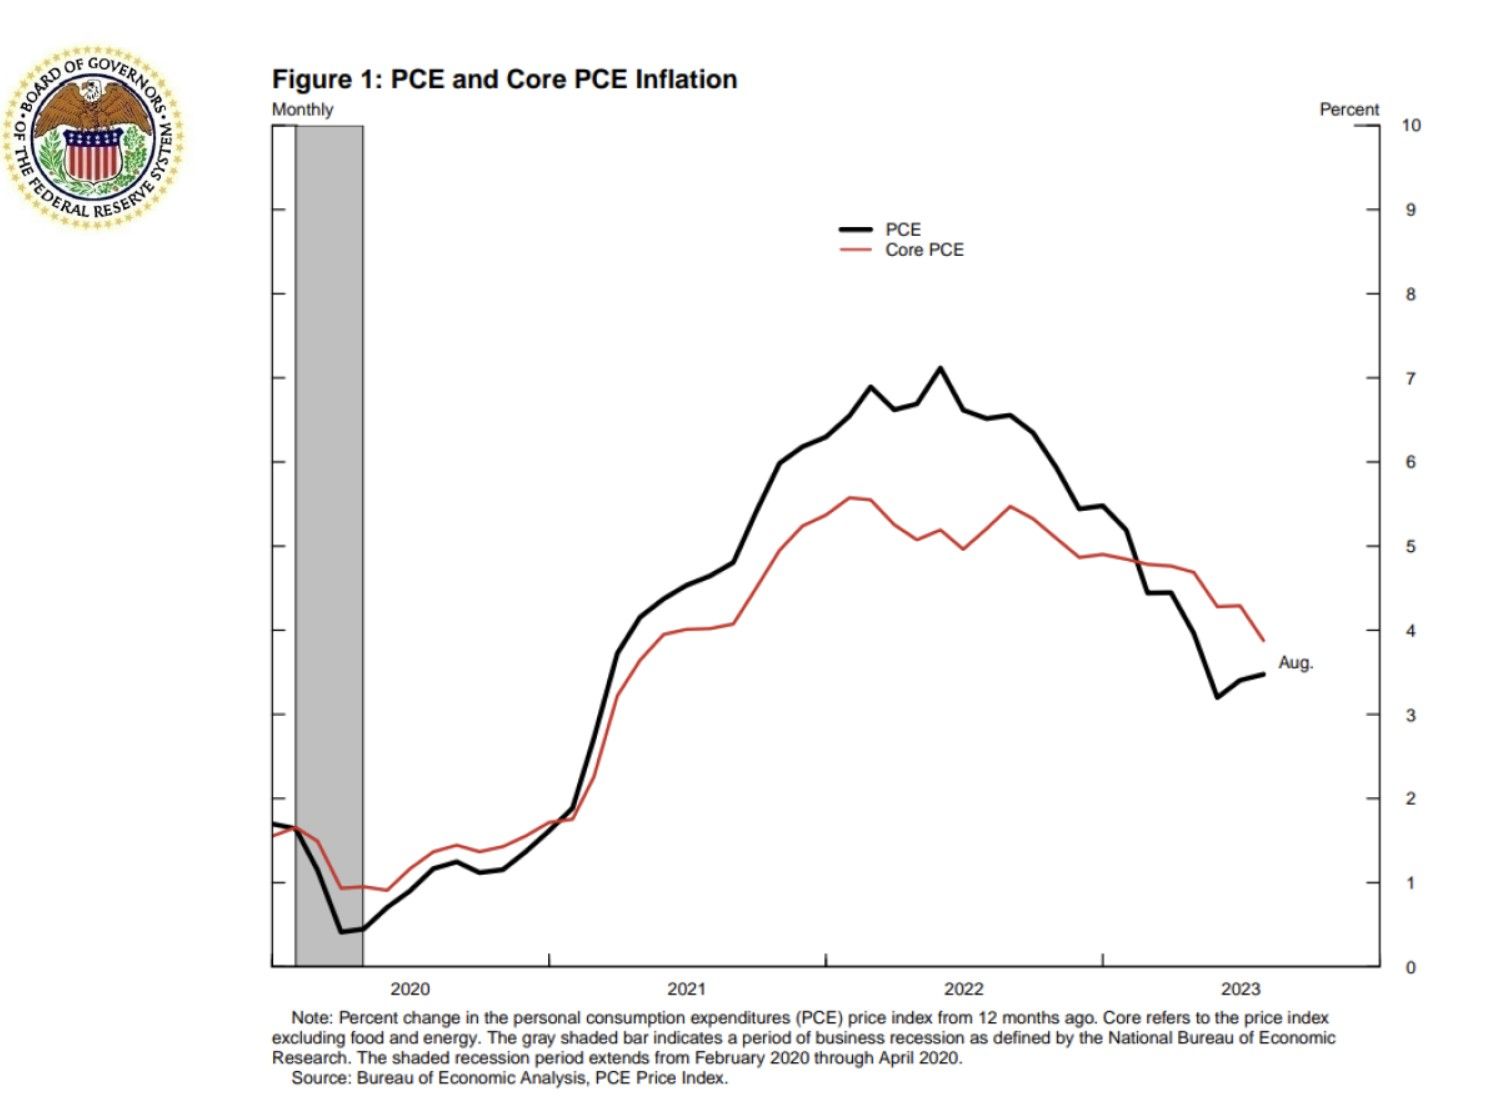
- "To better understand core inflation trends, I find it useful to look at three large categories that together make up the core PCE price index, because what has been causing inflation in each of these sectors is somewhat different."
- "The first category, core goods inflation, the red line in figure 2, has slowed strikingly, as supply chain–related price pressures continue to ease."
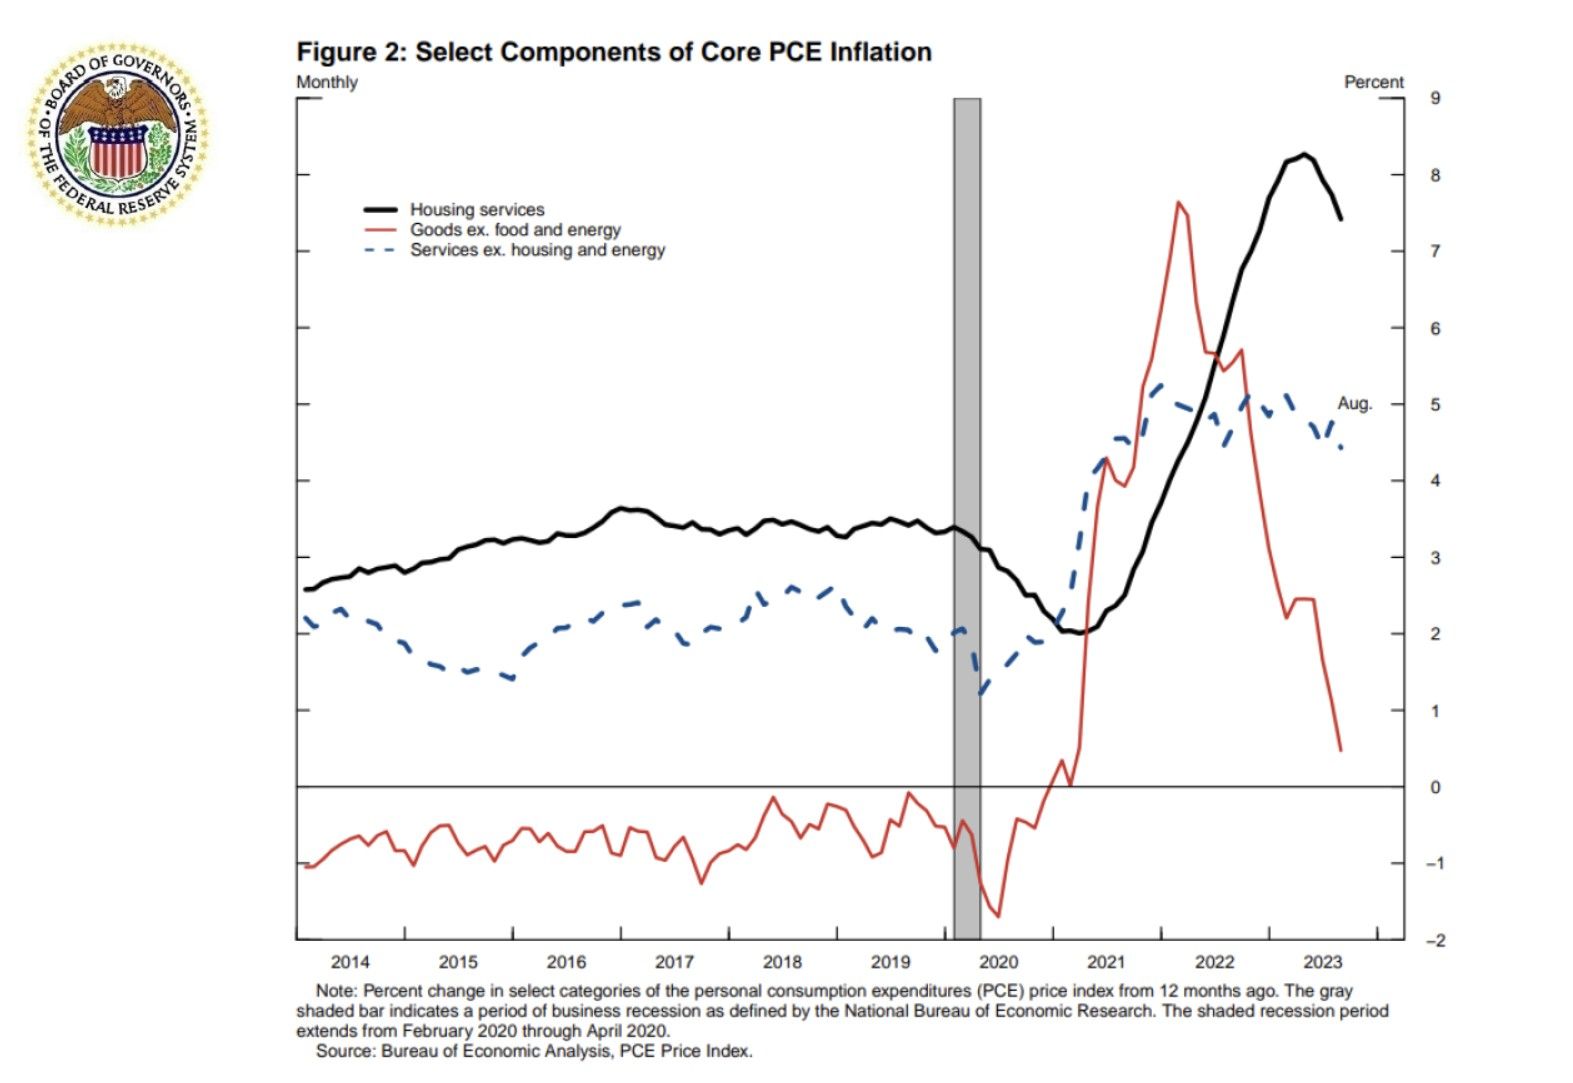
- "The second category, housing services price inflation, the black line, has clearly stepped down, as was anticipated given the previous slowing of increases in rents for new tenants."
- "In contrast, price increases for the third category, core nonhousing services, the blue line, have yet to show a significant slowdown."
- "Since this segment accounts for more than 50 percent of the overall core PCE index, we will need to see further slowing in this area to meet our inflation objective."
- "Nevertheless, I believe that core PCE prices will moderate further as the labor market comes into better balance."
The Labor Market:
- "Despite the strong September labor market data we received last week, there is evidence that the imbalance between labor demand and labor supply continues to narrow, as labor demand cools while labor supply improves. Even so, the labor market remains tight."
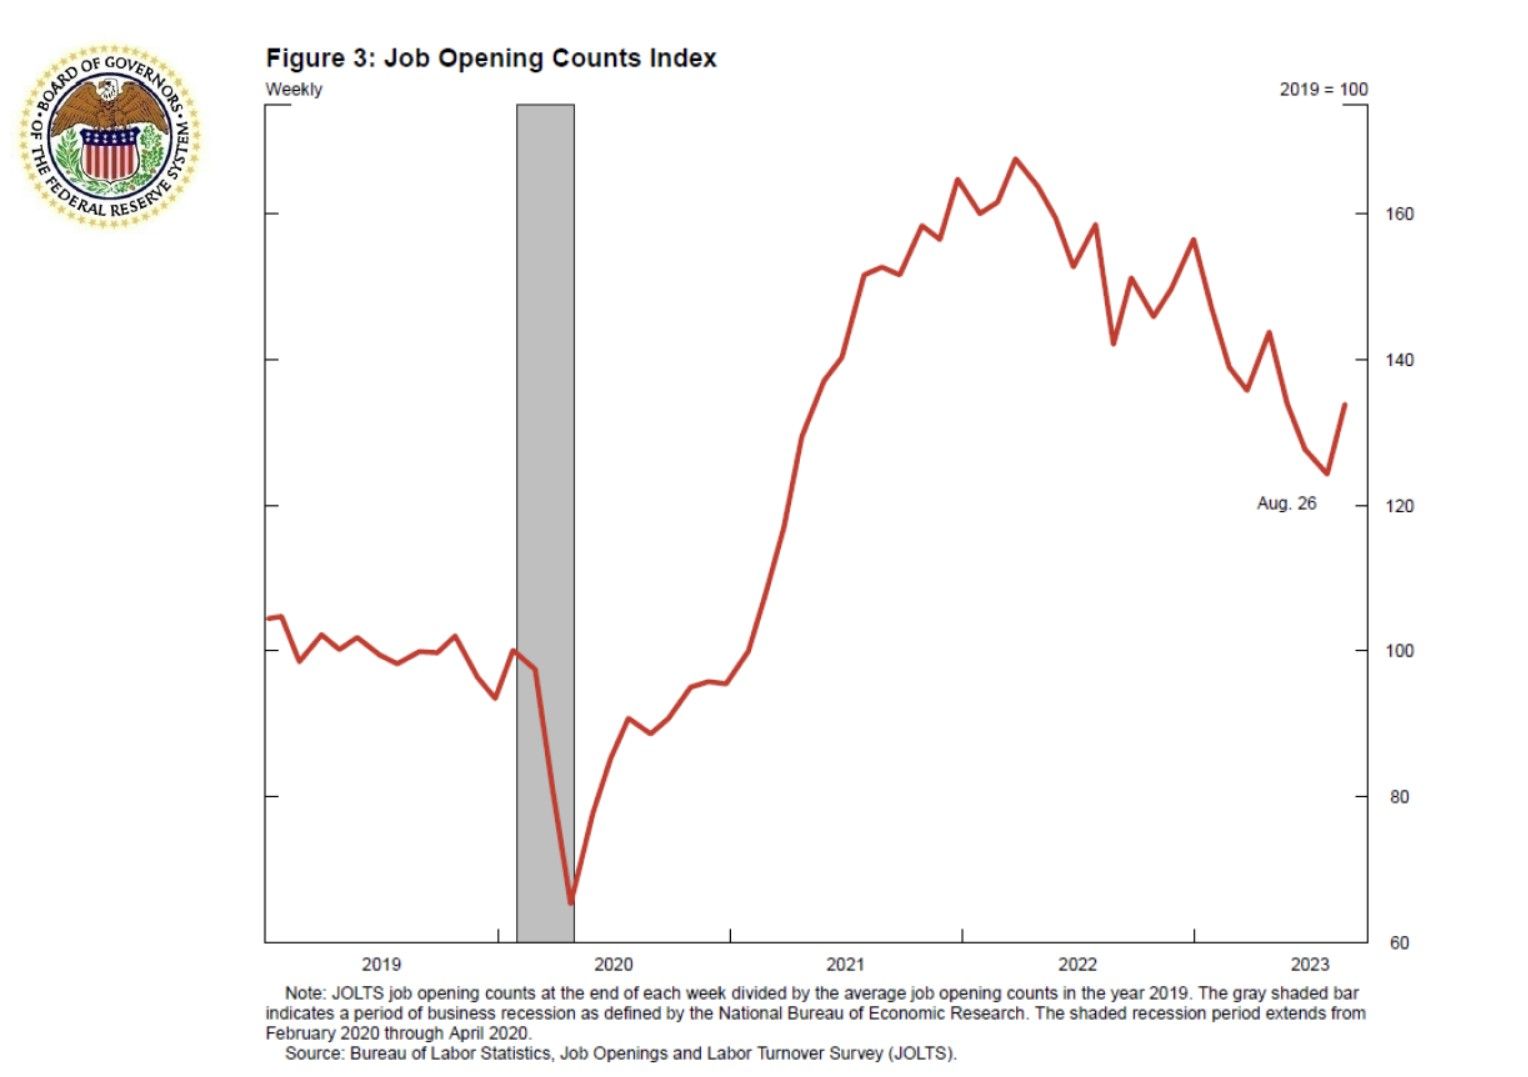
- "Consistent with cooling labor demand, job openings declined by nearly 1 million from the end of January to the end of August. Nevertheless, as shown in figure 3, job openings remain about 30 percent above their pre-pandemic level."
- "At the same time, layoffs have remained very low, and the pace of payroll employment gains remains strong, with September nonfarm payroll job gains coming in higher than expected."
- "In addition, the unemployment rate is 3.8 percent, a level that is still near historical lows."
- "The fact that the unemployment rate and layoffs have remained low over the past year amid disinflation suggests that there is a path to restoring price stability without the kind of substantial increase in unemployment that has often accompanied significant tightening cycles."
- "Improvements in labor supply are also contributing to rebalancing the labor market."
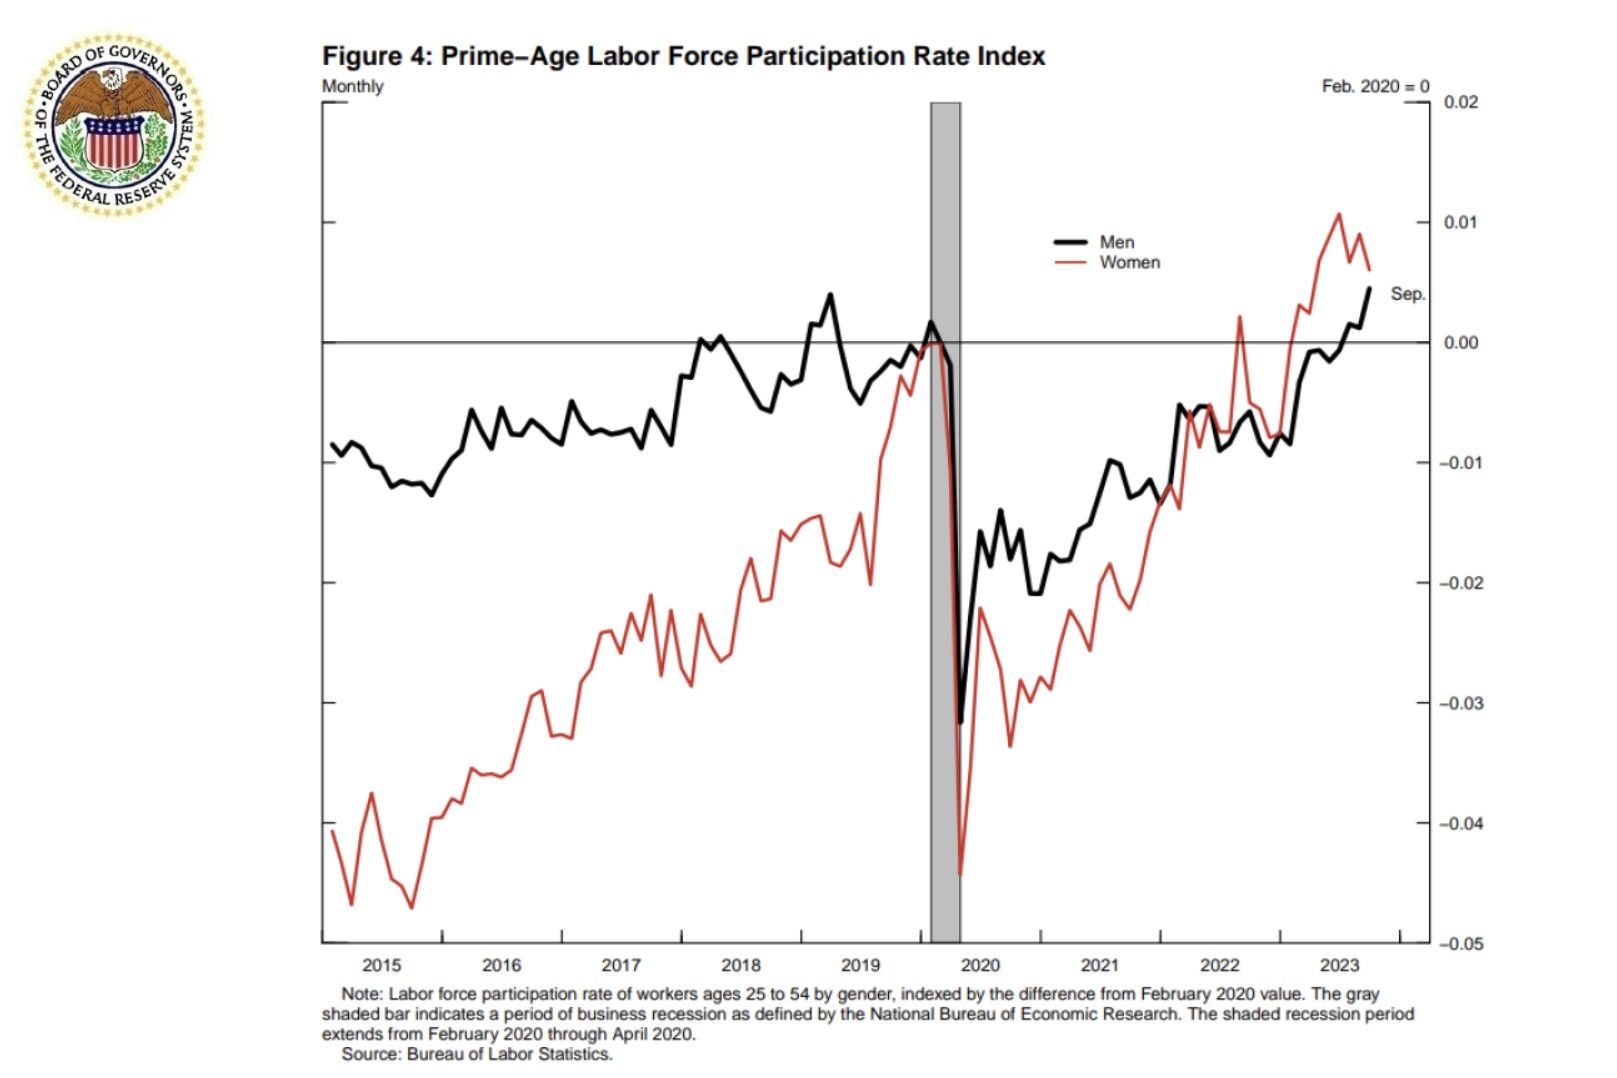
- "For instance, since the start of the year, the prime-age labor force participation rate, shown in figure 4, has moved up further. Immigration has also picked up, further contributing to the increase in labor supply."
- "Slowing labor demand and improving labor supply have eased pressure in the labor market, and my expectation is for further gradual easing in labor market conditions, as restrictive monetary policy continues to slow labor demand without causing an abrupt increase in layoffs or the unemployment rate."
Aggregate Economic Activity:
- "Data we have received so far point to solid economic growth in the third quarter, contrary to expectations earlier this year that the economy would slow."
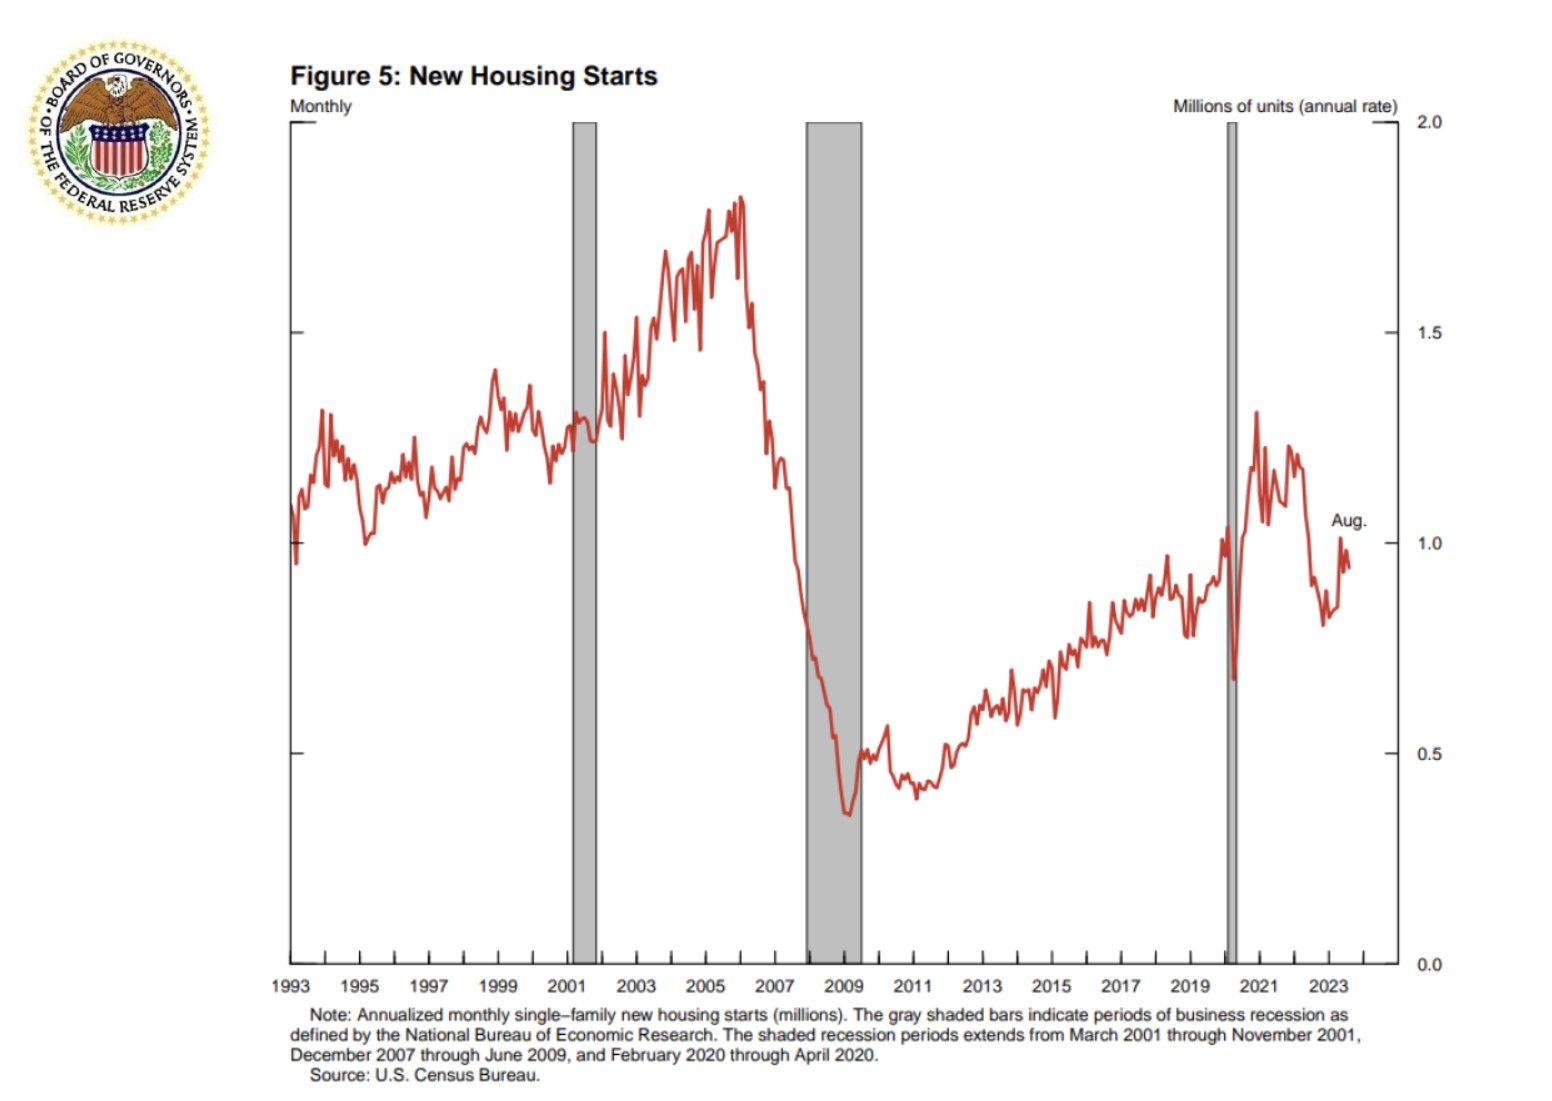
- "Consumer spending was strong in both July and August. Housing starts, shown in figure 5, are rebounding after a slowdown that was widely seen as caused by higher interest rates."
Risks Facing the U.S. Economy:
On the Transmission of Monetary Policy:
As you know, monetary policy is transmitted to the rest of the economy by affecting broad financial conditions, including market interest rates. Higher market rates raise the interest rates that households and businesses face and reduce the spending they undertake—most notably, spending on business fixed investment, residential construction, and consumer durables. Higher interest rates also affect asset prices. For example, higher interest rates, all else being equal, raise the exchange value of the dollar, which then boosts imports and reduces exports. Additionally, higher interest rates, along with a higher anticipated path of policy, lead investors to discount cash flows associated with longer-term investments at higher rates. This reduces the value of the stock market, which then reduces consumption through wealth effects and business investment through the cost of capital. In addition, monetary policy affects risk premiums. Tighter monetary policy tends to reduce the willingness of investors to bear risk, increasing yield spreads and reducing the prices for a range of asset classes and augmenting the direct effects on interest rates and asset prices described earlier.
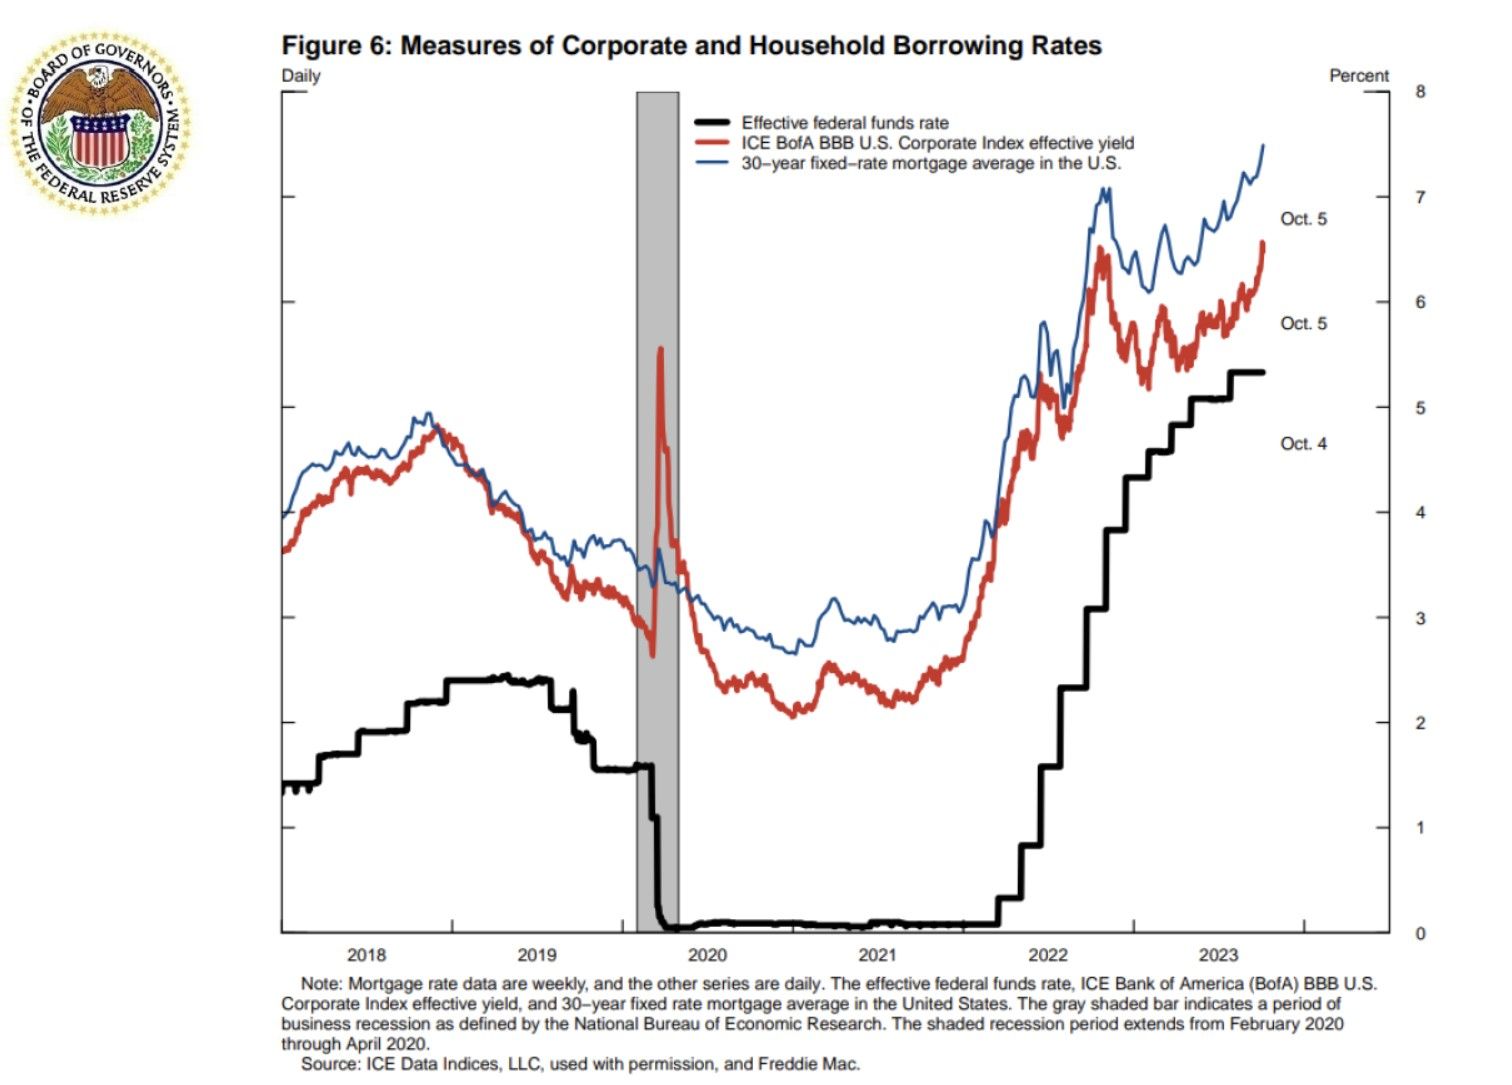
"Notice that both measures increased in early 2022 in response to Fed communications and in anticipation of increases in the effective federal funds rate, the black line. Recently, these long-term rates have increased further. More generally financial conditions have tightened further, and real long-term Treasury yields have risen significantly."
Monetary Policy Considerations:

TLDRS:
Vice Chair Philip N. Jefferson:
- "Even though recent inflation data have been encouraging, inflation remains too high.
- "In contrast, price increases for the third category, core nonhousing services, the blue line, have yet to show a significant slowdown."
- "Since this segment accounts for more than 50 percent of the overall core PCE index, we will need to see further slowing in this area to meet our inflation objective."
- "Nevertheless, I believe that core PCE prices will moderate further as the labor market comes into better balance."
- Reminder, while banks have the liquidity fairy, 'we' get the promise of 2 more rate hikes this year, Atlanta Fed President Raphael Bostic yet again enrichens himself inappropriately from his position.
- To fix one end of their mandate (price stability) from the inflation problem they created, the Fed will continue sacrificing employment (the other end of their mandate) to bolster price stability by continuing to raise interest rates--causing further stress to businesses and households.
- I believe inflation is the match that has been lit that will light the fuse of our rocket.

Reddit Post
Full Speech:
Introduction
Thank you for inviting me to join this conference and for the kind introduction. It is a pleasure to be here.
Before I begin, let me remind you that the views I will express today are my own and are not necessarily those of my colleagues in the Federal Reserve System.
I will take this opportunity to share with you my outlook on the U.S. economy. I will also discuss risks facing the economy. Then, I will turn to the transmission of monetary policy, including some recent evidence on a source of lagged effects of policy. Finally, I will discuss considerations for monetary policy that follow from efforts to manage risks given the lagged effects of monetary policy. These considerations include the need to proceed carefully as the risks of tightening monetary policy too much relative to those of not tightening enough move closer into balance. With that, let me turn to my outlook for the U.S. economy.
The Inflation Outlook
Even though recent inflation data have been encouraging, inflation remains too high. Over the 12 months ending in August, total Personal Consumption Expenditures (PCE) prices rose 3.5 percent, the black line in figure 1. Excluding the volatile food and energy categories, core PCE prices rose 3.9 percent, the red line. To better understand core inflation trends, I find it useful to look at three large categories that together make up the core PCE price index, because what has been causing inflation in each of these sectors is somewhat different. The first category, core goods inflation, the red line in figure 2, has slowed strikingly, as supply chain–related price pressures continue to ease. The second category, housing services price inflation, the black line, has clearly stepped down, as was anticipated given the previous slowing of increases in rents for new tenants. In contrast, price increases for the third category, core nonhousing services, the blue line, have yet to show a significant slowdown. Since this segment accounts for more than 50 percent of the overall core PCE index, we will need to see further slowing in this area to meet our inflation objective. Nevertheless, I believe that core PCE prices will moderate further as the labor market comes into better balance.
The Labor Market
Despite the strong September labor market data we received last week, there is evidence that the imbalance between labor demand and labor supply continues to narrow, as labor demand cools while labor supply improves. Even so, the labor market remains tight.
Consistent with cooling labor demand, job openings declined by nearly 1 million from the end of January to the end of August. Nevertheless, as shown in figure 3, job openings remain about 30 percent above their pre-pandemic level. At the same time, layoffs have remained very low, and the pace of payroll employment gains remains strong, with September nonfarm payroll job gains coming in higher than expected. In addition, the unemployment rate is 3.8 percent, a level that is still near historical lows. The fact that the unemployment rate and layoffs have remained low over the past year amid disinflation suggests that there is a path to restoring price stability without the kind of substantial increase in unemployment that has often accompanied significant tightening cycles.
Improvements in labor supply are also contributing to rebalancing the labor market. For instance, since the start of the year, the prime-age labor force participation rate, shown in figure 4, has moved up further. Immigration has also picked up, further contributing to the increase in labor supply. Slowing labor demand and improving labor supply have eased pressure in the labor market, and my expectation is for further gradual easing in labor market conditions, as restrictive monetary policy continues to slow labor demand without causing an abrupt increase in layoffs or the unemployment rate.
Aggregate Economic Activity
Data we have received so far point to solid economic growth in the third quarter, contrary to expectations earlier this year that the economy would slow. Consumer spending was strong in both July and August. Housing starts, shown in figure 5, are rebounding after a slowdown that was widely seen as caused by higher interest rates. Despite the signs of resilience in the economy this year, some analysts expected slower economic growth this fall, which leads me to the next topic: What are some near-term risks facing the U.S. economy?
Risks Facing the U.S. Economy
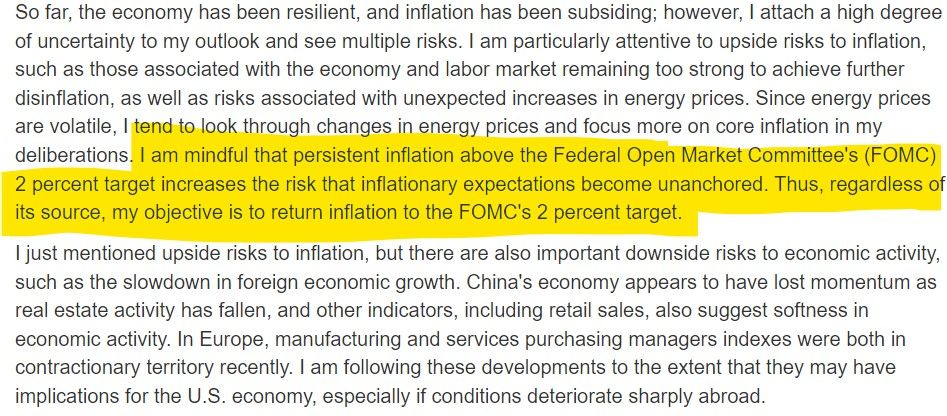
So far, the economy has been resilient, and inflation has been subsiding; however, I attach a high degree of uncertainty to my outlook and see multiple risks. I am particularly attentive to upside risks to inflation, such as those associated with the economy and labor market remaining too strong to achieve further disinflation, as well as risks associated with unexpected increases in energy prices. Since energy prices are volatile, I tend to look through changes in energy prices and focus more on core inflation in my deliberations. I am mindful that persistent inflation above the Federal Open Market Committee's (FOMC) 2 percent target increases the risk that inflationary expectations become unanchored. Thus, regardless of its source, my objective is to return inflation to the FOMC's 2 percent target.
I just mentioned upside risks to inflation, but there are also important downside risks to economic activity, such as the slowdown in foreign economic growth. China's economy appears to have lost momentum as real estate activity has fallen, and other indicators, including retail sales, also suggest softness in economic activity. In Europe, manufacturing and services purchasing managers indexes were both in contractionary territory recently. I am following these developments to the extent that they may have implications for the U.S. economy, especially if conditions deteriorate sharply abroad.
On the Transmission of Monetary Policy
As you know, monetary policy is transmitted to the rest of the economy by affecting broad financial conditions, including market interest rates. Higher market rates raise the interest rates that households and businesses face and reduce the spending they undertake—most notably, spending on business fixed investment, residential construction, and consumer durables. Higher interest rates also affect asset prices. For example, higher interest rates, all else being equal, raise the exchange value of the dollar, which then boosts imports and reduces exports. Additionally, higher interest rates, along with a higher anticipated path of policy, lead investors to discount cash flows associated with longer-term investments at higher rates. This reduces the value of the stock market, which then reduces consumption through wealth effects and business investment through the cost of capital. In addition, monetary policy affects risk premiums.1 Tighter monetary policy tends to reduce the willingness of investors to bear risk, increasing yield spreads and reducing the prices for a range of asset classes and augmenting the direct effects on interest rates and asset prices described earlier.
Figure 6 illustrates how long-term interest rates move in anticipation of changes in the federal funds rate. The red line is the average long-term triple-B corporate bond rate, a measure of corporate borrowing costs. The blue line is the average 30-year mortgage rate, a measure of household borrowing costs. Notice that both measures increased in early 2022 in response to Fed communications and in anticipation of increases in the effective federal funds rate, the black line. Recently, these long-term rates have increased further. More generally financial conditions have tightened further, and real long-term Treasury yields have risen significantly. More on this later.
In a speech last spring, I noted that we are still learning about the full effect of our policy tightening in this post-pandemic cycle.2 Thus, I am also mindful of factors that could attenuate or delay the transmission of monetary policy. One such factor is that the bulk of corporate debt issued by large firms has not yet had to be refinanced since the FOMC started to tighten monetary policy in March 2022.
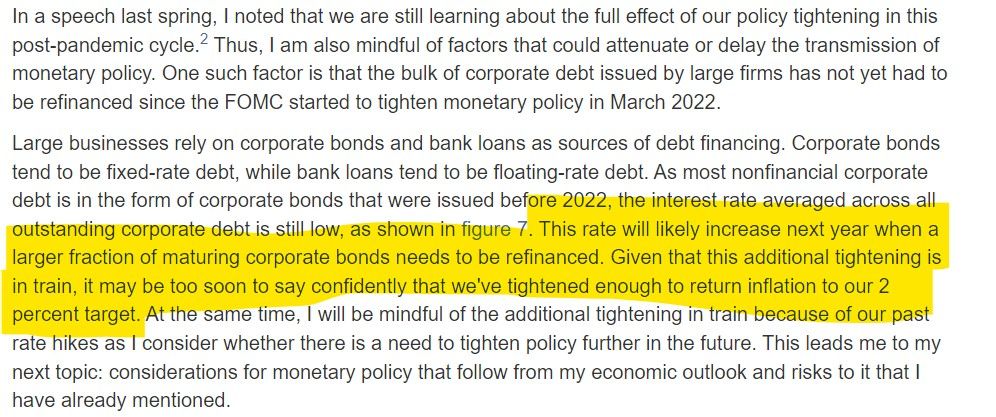
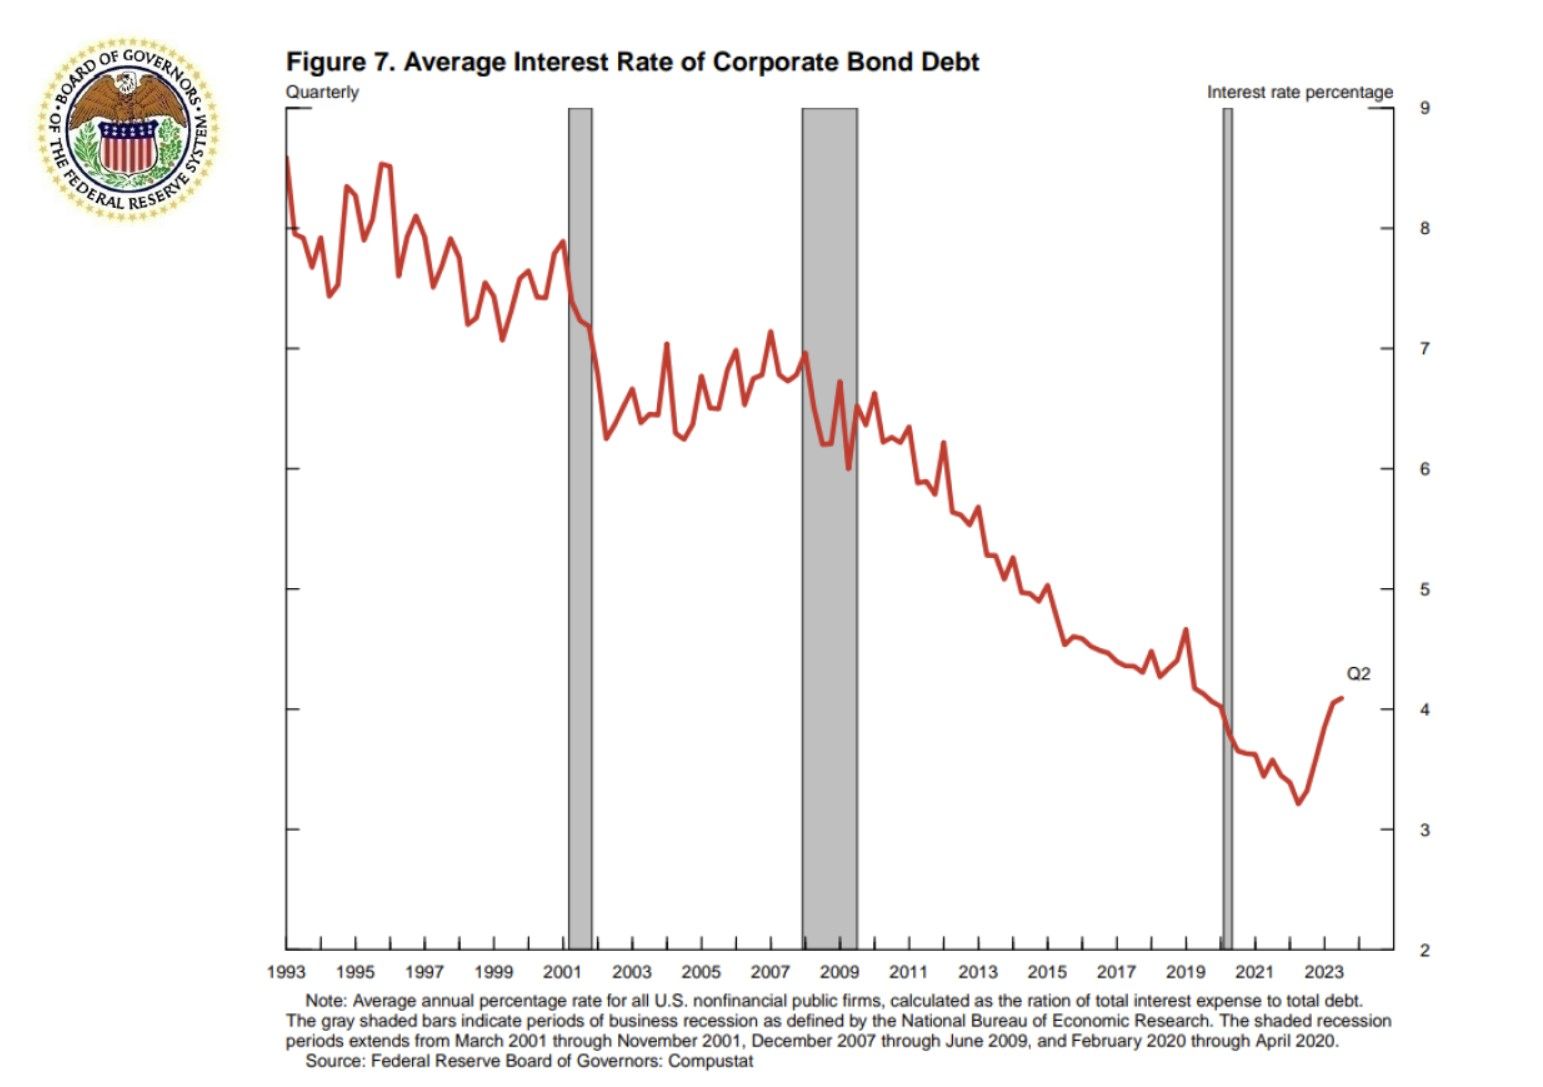
Large businesses rely on corporate bonds and bank loans as sources of debt financing. Corporate bonds tend to be fixed-rate debt, while bank loans tend to be floating-rate debt. As most nonfinancial corporate debt is in the form of corporate bonds that were issued before 2022, the interest rate averaged across all outstanding corporate debt is still low, as shown in figure 7. This rate will likely increase next year when a larger fraction of maturing corporate bonds needs to be refinanced. Given that this additional tightening is in train, it may be too soon to say confidently that we've tightened enough to return inflation to our 2 percent target. At the same time, I will be mindful of the additional tightening in train because of our past rate hikes as I consider whether there is a need to tighten policy further in the future. This leads me to my next topic: considerations for monetary policy that follow from my economic outlook and risks to it that I have already mentioned.
Monetary Policy Considerations
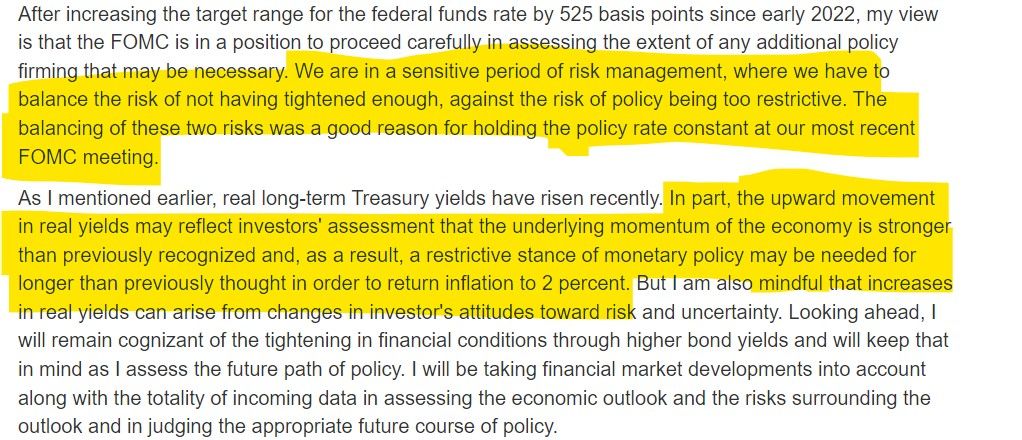
After increasing the target range for the federal funds rate by 525 basis points since early 2022, my view is that the FOMC is in a position to proceed carefully in assessing the extent of any additional policy firming that may be necessary. We are in a sensitive period of risk management, where we have to balance the risk of not having tightened enough, against the risk of policy being too restrictive. The balancing of these two risks was a good reason for holding the policy rate constant at our most recent FOMC meeting.
As I mentioned earlier, real long-term Treasury yields have risen recently. In part, the upward movement in real yields may reflect investors' assessment that the underlying momentum of the economy is stronger than previously recognized and, as a result, a restrictive stance of monetary policy may be needed for longer than previously thought in order to return inflation to 2 percent. But I am also mindful that increases in real yields can arise from changes in investor's attitudes toward risk and uncertainty. Looking ahead, I will remain cognizant of the tightening in financial conditions through higher bond yields and will keep that in mind as I assess the future path of policy. I will be taking financial market developments into account along with the totality of incoming data in assessing the economic outlook and the risks surrounding the outlook and in judging the appropriate future course of policy.
Thank you!
References
Bernanke, Ben S., and Kenneth N. Kuttner (2005). "What Explains the Stock Market's Reaction to Federal Reserve Policy?" Journal of Finance, vol. 60 (June), pp. 1221–57.
Campbell, John Y., and John H. Cochrane (1999). "By Force of Habit: A Consumption-Based Explanation of Aggregate Stock Market Behavior," Journal of Political Economy, vol. 107 (April), pp. 205–51.
Gertler, Mark, and Peter Karadi (2015). "Monetary Policy Surprises, Credit Costs, and Economic Activity," American Economic Journal: Macroeconomics, vol. 7 (January), pp. 44–76.
Hanson, Samuel G., and Jeremy C. Stein (2015). "Monetary Policy and Long-Term Real Rates," Journal of Financial Economics, vol. 115 (March), pp. 429–48.
Jefferson, Philip N. (2023). "Implementation and Transmission of Monetary Policy," speech delivered at the H. Parker Willis Lecture, Washington and Lee University, Lexington, Va., March 27.
Piazzesi, Monika, and Martin Schneider (2006). "Equilibrium Yield Curves (PDF)," NBER Working Paper Series 12609. Cambridge, Mass.: National Bureau of Economic Research, October (revised January 2007).
1. Bernanke and Kuttner (2005), Hanson and Stein (2015), and Gertler and Karadi (2015), among others, highlight that monetary policy affects risk premiums. Policy tightening tends to reduce the willingness of investors to bear risk—for example, by reducing expected levels of consumption (Campbell and Cochrane, 1999). If policy tightens in response to inflationary shocks, term premiums also tend to rise as longer-maturity bonds become riskier (Piazzesi and Schneider, 2006). Policy tightening can also lower stock prices by increasing the expected equity premium—for example, by weakening the balance sheet of leverage firms and making their stocks riskier. Return to text
2. See Jefferson (2023). Return to text
