Bureau of Labor Statistics: Employment rose by 336,000 in September. Average hourly earnings up .2% for the month and 4.2% for the year. More inflation fuel!
Highlights:
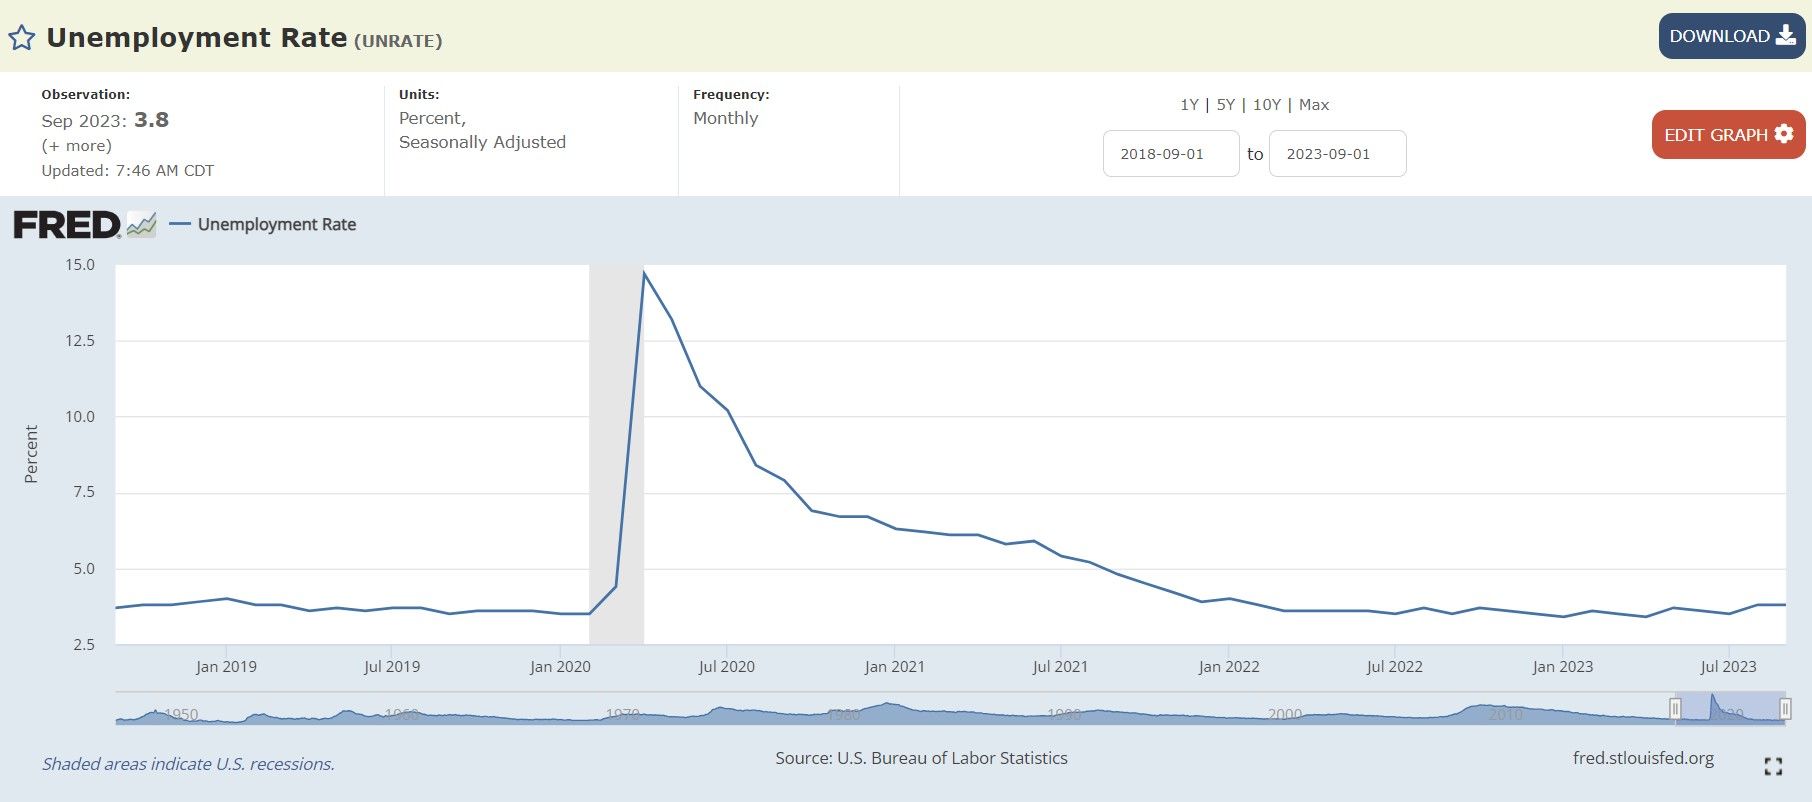
- Total nonfarm payroll employment rose by 336,000 in September, and the unemployment rate was unchanged at 3.8 percent--analysts had been expecting 170,000 new workers and 3.7% unemployment...
- The number of unemployed persons was essentially unchanged at 6.4 million.
- The unemployment rates for adult men (3.8 percent), adult women (3.1 percent), teenagers (11.6 percent), Whites (3.4 percent), Blacks (5.7 percent), Asians (2.8 percent), and Hispanics (4.6 percent) showed little or no change in September.
- The number of long-term unemployed (those jobless for 27 weeks or more) was little changed at 1.2 million in September.
- The long-term unemployed accounted for 19.1 percent of all unemployed persons.
- Both the labor force participation rate, at 62.8 percent, and the employment-population ratio, at 60.4 percent, were unchanged over the month.
- In September, job gains occurred in leisure and hospitality; government; health care; professional, scientific, and technical services; and social assistance.
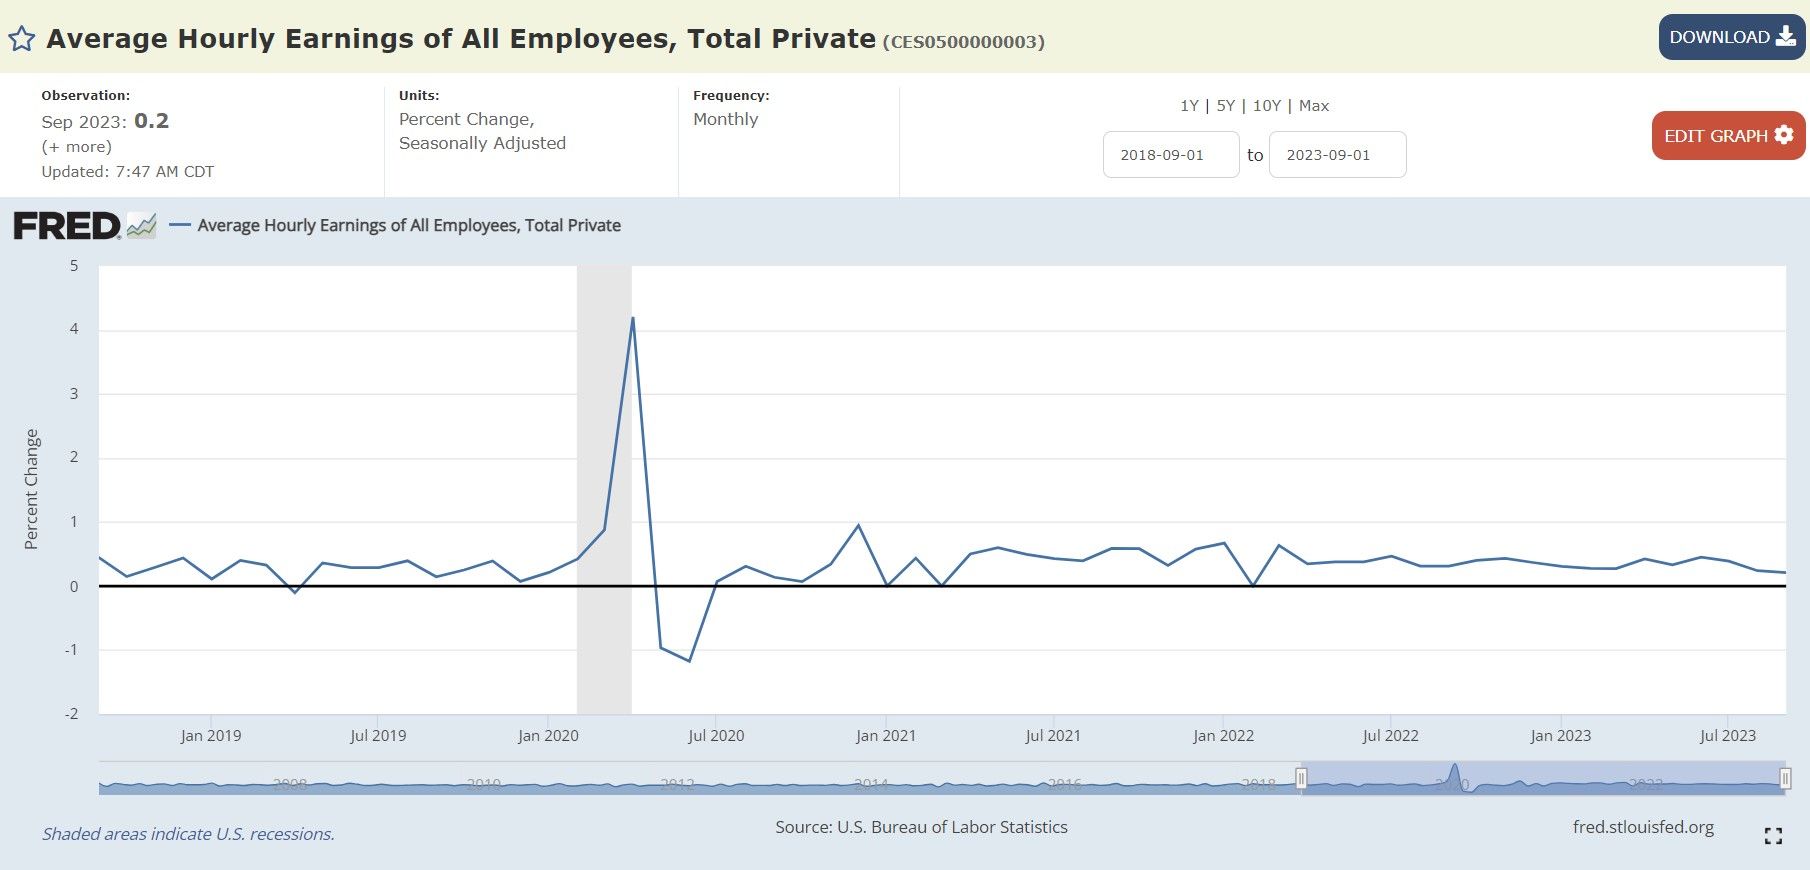
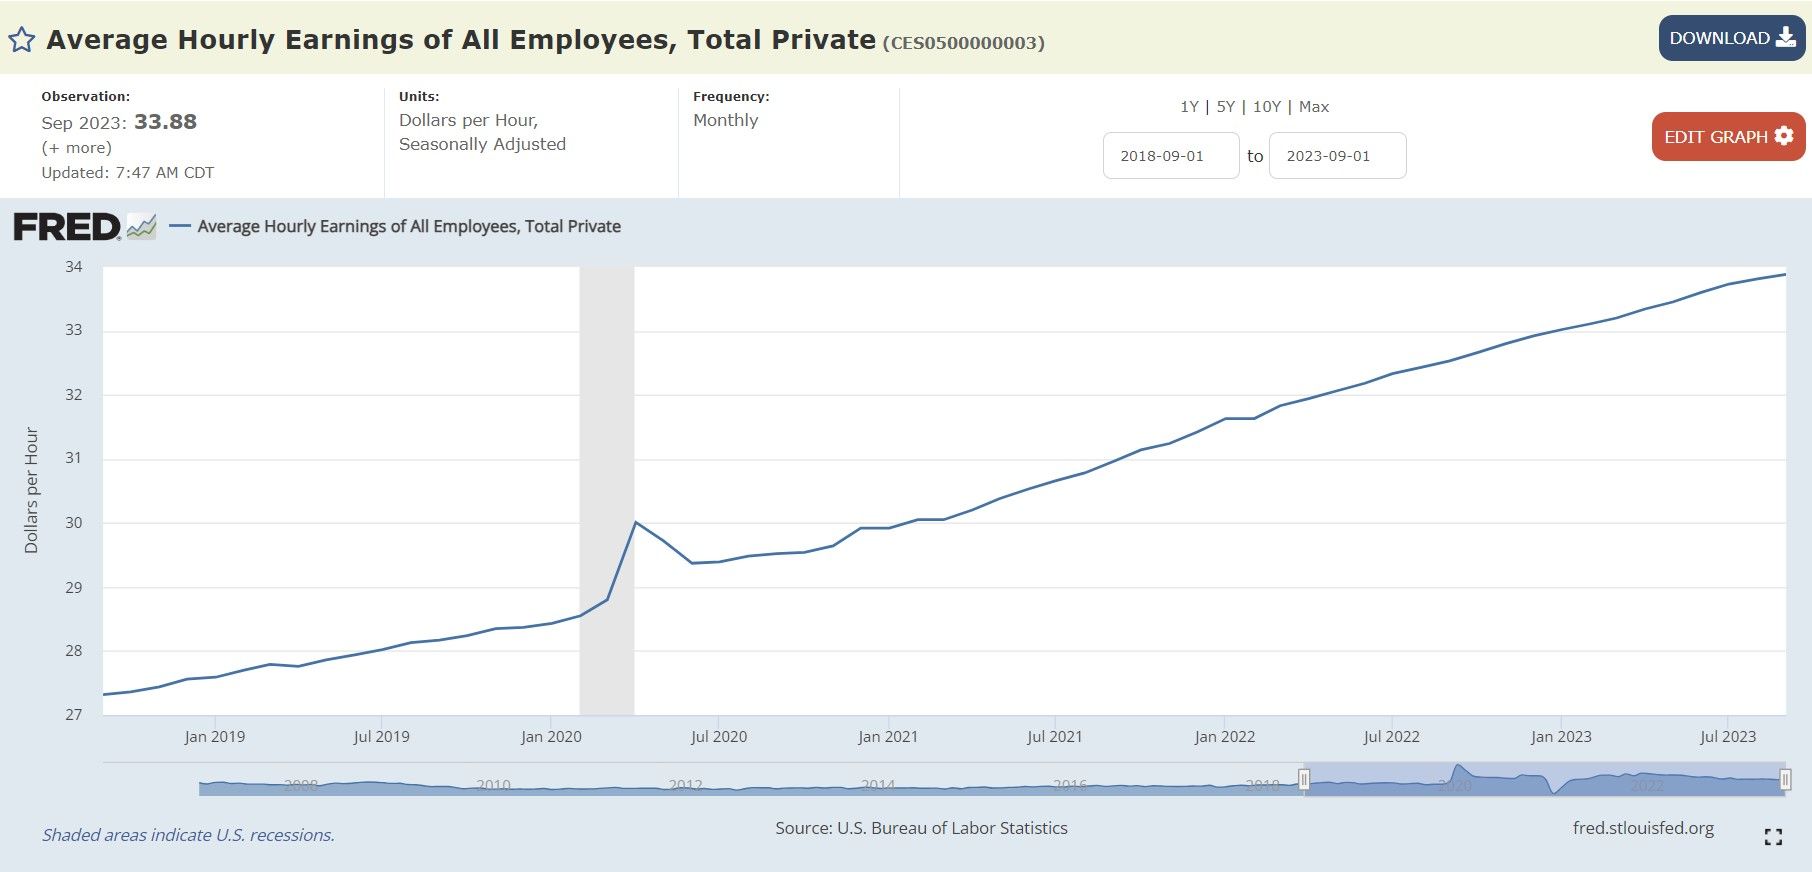
- In September, average hourly earnings for all employees on private nonfarm payrolls rose by 7 cents, or 0.2 percent, to $33.88.
- Over the past 12 months, average hourly earnings have increased by 4.2 percent.
- The average workweek for all employees on private nonfarm payrolls was unchanged at 34.4 hours in September.
Monthly Jobs Growth:
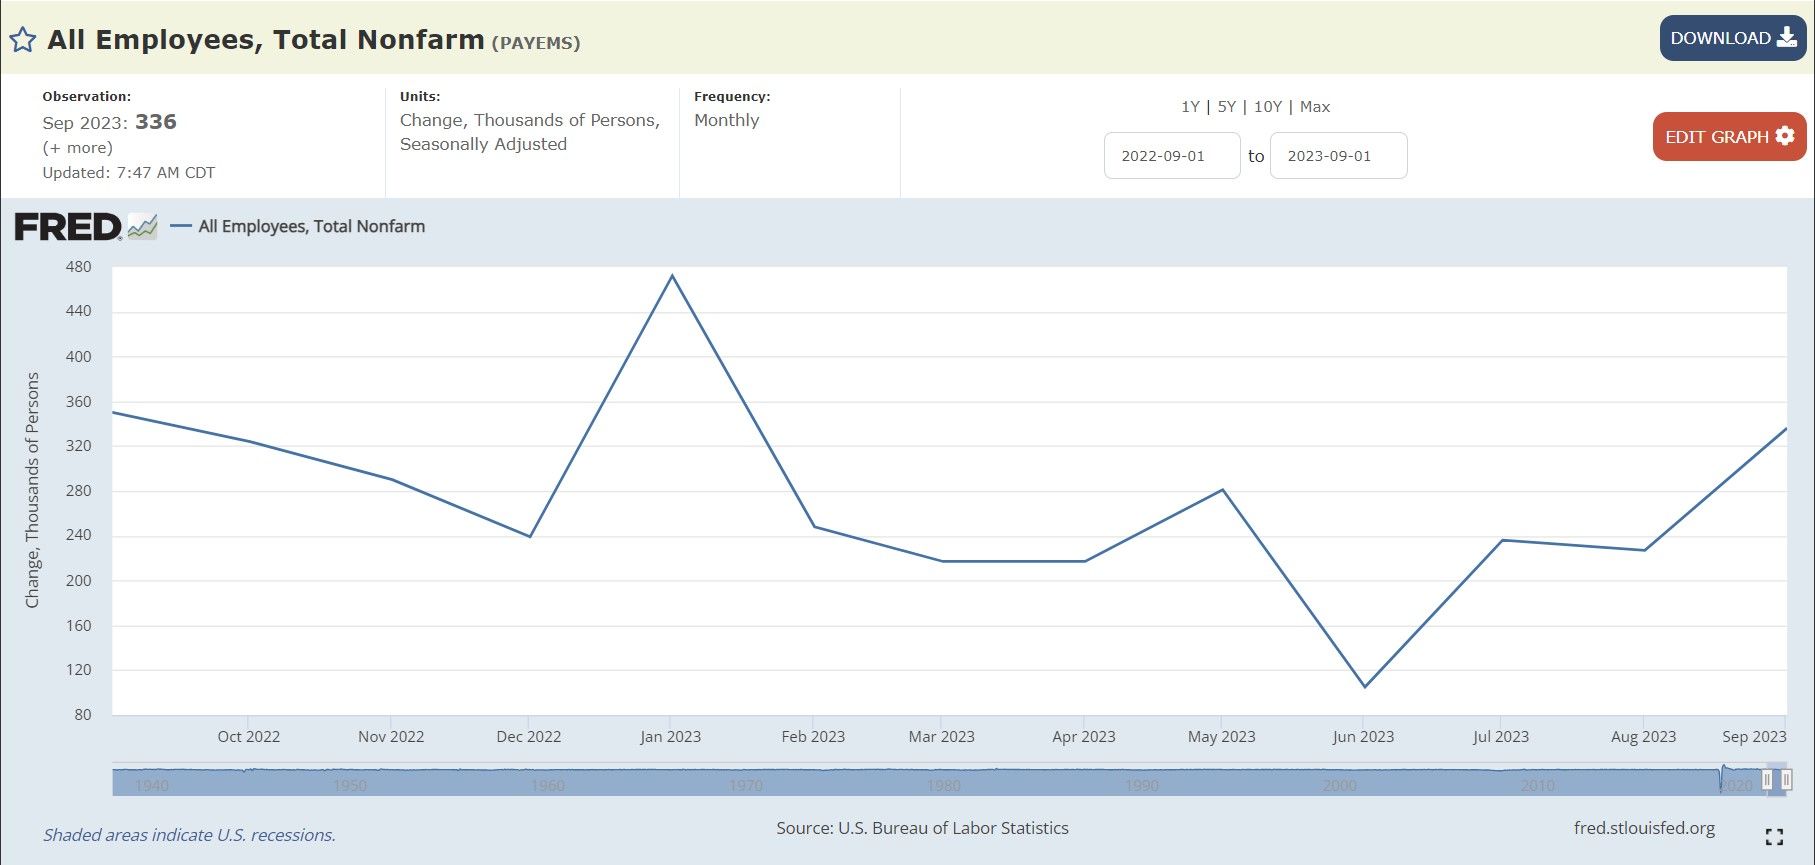
Total nonfarm payroll employment rose by 336,000 in September, and the unemployment rate was unchanged at 3.8 percent--analysts had been expecting 170,00 new workers and 3.7% unemployment...
Continued strong hiring (with wages growing) gives the Fed more ammunition for rate hike(s).
Unemployment Rate:
Average Hourly Earnings:
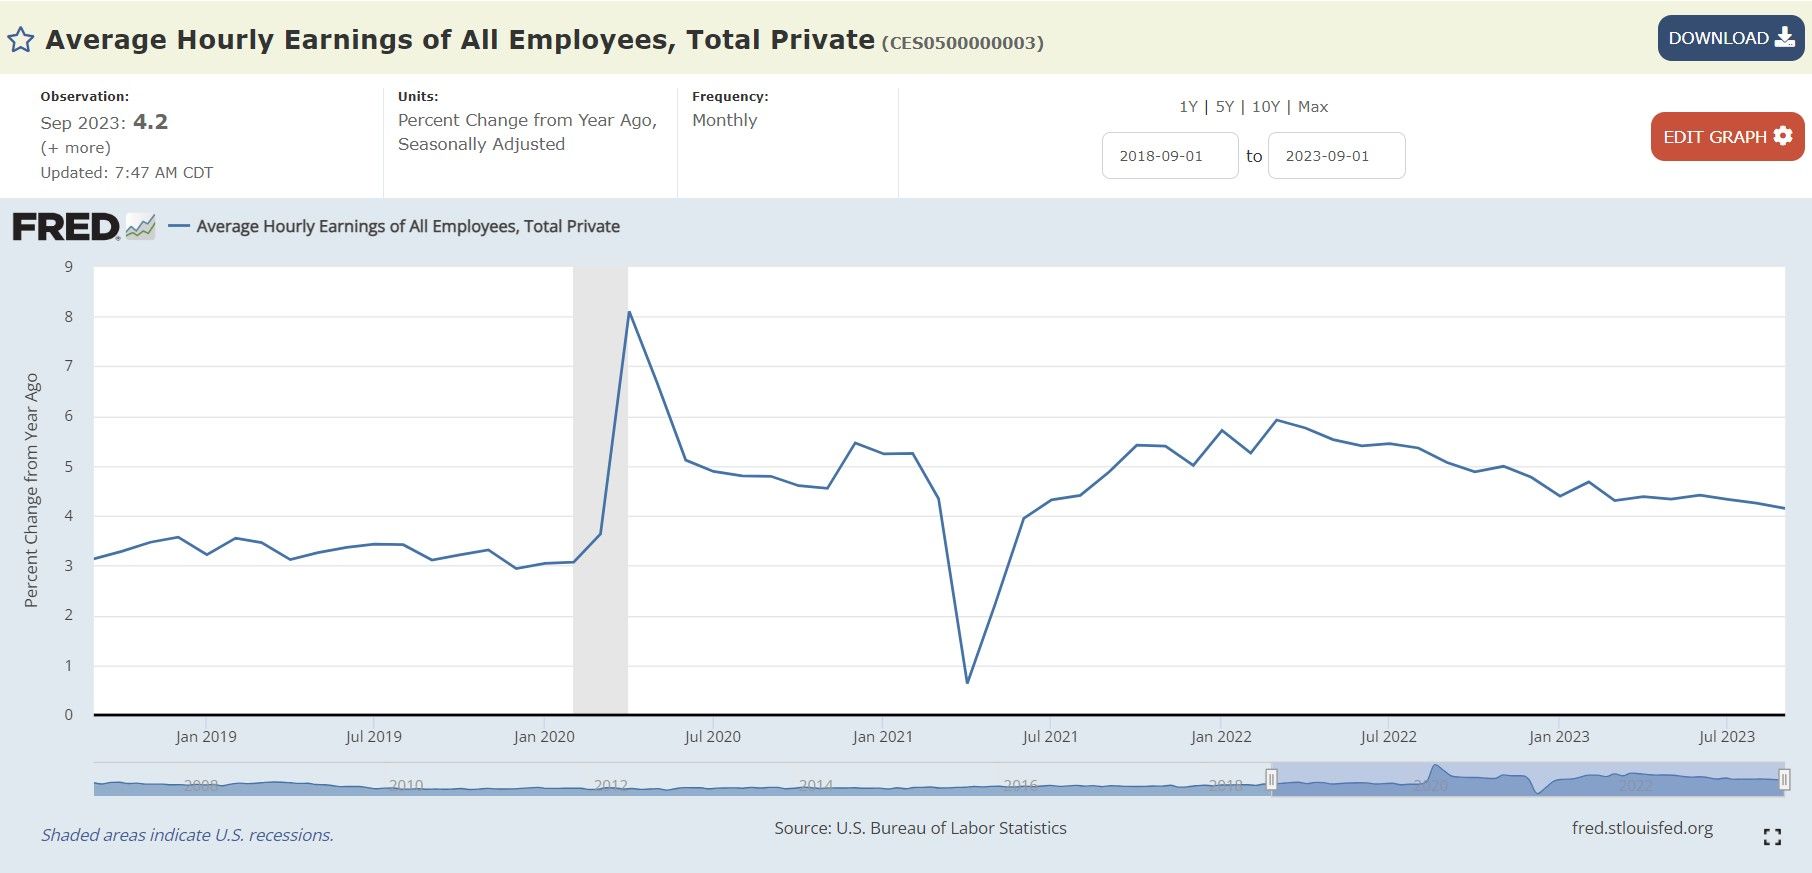
Again, this strong job and wage growth is more fuel for the inflation fire, which means more fuel for rate hikes.
To fix one end of their mandate (price stability) from the inflation problem they created, the Fed will continue sacrificing employment (the other end of their mandate) to bolster price stability by continuing to raise interest rates--causing further stress to businesses and households.
This report is flying in the face of their stated goals from the Fed's Beige Book in August when:
"Many contacts suggested "the second half of the year will be different" when describing wage growth.
Recall, it was also reported, "Some Districts highlighted reports suggesting consumers may have exhausted their savings and are relying more on borrowing to support spending.", so one has to wonder how much this wage growth will keep up with spending?
This strong employment and wage report catches households by surprise:
Recall, when the Federal Reserve Bank of New York’s Center for Microeconomic Data released the August 2023 Survey of Consumer Expectations and households were much more negative:
- Income growth perceptions declined in August, and job loss expectations rose sharply to its highest level since April 2021.
- Perceptions about current credit conditions and expectations about future conditions both deteriorated.
- Households’ perceptions about their current financial situations and expectations for the future also deteriorated.
Labor Market:
- Median one-year-ahead expected earnings growth rose by 0.1 percentage point to 2.9% in August. The series has been moving within a narrow range of 2.8% to 3.0% since September 2021.
- Mean unemployment expectations—or the mean probability that the U.S. unemployment rate will be higher one year from now—increased by 1.8 percentage points to 38.5%, remaining below its 12-month trailing average of 40.2%.
The mean perceived probability of losing one’s job in the next 12 months rose by 2.0 percentage points to 13.8%, its highest reading since April 2021:
- The mean probability of leaving one’s job voluntarily in the next 12 months also increased by 1.9 percentage points to 18.9%.
- Both increases were most pronounced for respondents with a high school education or less and annual household income below $50k.
- The mean perceived probability of finding a job (if one’s current job was lost) decreased by 0.1 percentage point to 55.7%.

TLDRS:
- Total nonfarm payroll employment rose by 336,000 in September, and the unemployment rate was unchanged at 3.8 percent--analysts had been expecting 170,000 new workers and 3.7% unemployment.
- Households were also braced for much worse news.
- Strong job and wage growth is more fuel for the inflation fire, which means more fuel for rate hikes.
- I believe inflation is the match that has been lit that will light the fuse of our rocket.

Reddit Post
Full Report:
Total nonfarm payroll employment rose by 336,000 in September, and the unemployment rate was unchanged at 3.8 percent, the U.S. Bureau of Labor Statistics reported today. Job gains occurred in leisure and hospitality; government; health care; professional, scientific, and technical services; and social assistance. This news release presents statistics from two monthly surveys. The household survey measures labor force status, including unemployment, by demographic characteristics. The establishment survey measures nonfarm employment, hours, and earnings by industry. For more information about the concepts and statistical methodology used in these two surveys, see the Technical Note. Household Survey Data The major labor market indicators from the survey of households showed little or no change over the month. The unemployment rate held at 3.8 percent in September, and the number of unemployed persons was essentially unchanged at 6.4 million. (See table A-1.) Among the major worker groups, the unemployment rates for adult men (3.8 percent), adult women (3.1 percent), teenagers (11.6 percent), Whites (3.4 percent), Blacks (5.7 percent), Asians (2.8 percent), and Hispanics (4.6 percent) showed little or no change in September. (See tables A-1, A-2, and A-3.) The number of long-term unemployed (those jobless for 27 weeks or more) was little changed at 1.2 million in September. The long-term unemployed accounted for 19.1 percent of all unemployed persons. (See table A-12.) Both the labor force participation rate, at 62.8 percent, and the employment-population ratio, at 60.4 percent, were unchanged over the month. (See table A-1.) The number of persons employed part time for economic reasons, at 4.1 million, changed little in September. These individuals, who would have preferred full-time employment, were working part time because their hours had been reduced or they were unable to find full-time jobs. (See table A-8.) In September, the number of persons not in the labor force who currently want a job was 5.5 million, little different from the prior month. These individuals were not counted as unemployed because they were not actively looking for work during the 4 weeks preceding the survey or were unavailable to take a job. (See table A-1.) Among those not in the labor force who wanted a job, the number of persons marginally attached to the labor force changed little at 1.5 million in September. These individuals wanted and were available for work and had looked for a job sometime in the prior 12 months but had not looked for work in the 4 weeks preceding the survey. The number of discouraged workers, a subset of the marginally attached who believed that no jobs were available for them, also changed little over the month at 367,000. (See Summary table A.) Establishment Survey Data Total nonfarm payroll employment rose by 336,000 in September, above the average monthly gain of 267,000 over the prior 12 months. In September, job gains occurred in leisure and hospitality; government; health care; professional, scientific, and technical services; and social assistance. (See table B-1.) Leisure and hospitality added 96,000 jobs in September, above the average monthly gain of 61,000 over the prior 12 months. Employment in food services and drinking places rose by 61,000 over the month and has returned to its pre-pandemic February 2020 level. Accommodation employment continued to trend up over the month (+16,000) but remains below its February 2020 level by 217,000, or 10.3 percent. In September, government employment increased by 73,000, above the average monthly gain of 47,000 over the prior 12 months. Over the month, job gains occurred in state government education (+29,000) and in local government, excluding education (+27,000). Employment in government is slightly below (-9,000) its February 2020 level. Health care added 41,000 jobs in September, compared with the average monthly gain of 53,000 over the prior 12 months. Over the month, employment continued to trend up in ambulatory health care services (+24,000), hospitals (+8,000), and nursing and residential care facilities (+8,000). Employment in professional, scientific, and technical services increased by 29,000 in September, in line with the average monthly gain of 27,000 over the prior 12 months. Social assistance added 25,000 jobs in September, about the same as the average monthly gain of 23,000 over the prior 12 months. Over the month, job growth occurred in individual and family services (+19,000). In September, employment in transportation and warehousing changed little (+9,000). Truck transportation added 9,000 jobs, following a decline of 25,000 in August that largely reflected a business closure. Air transportation added 5,000 jobs in September. Employment in transportation and warehousing has shown little net change over the year. Employment in information changed little in September (-5,000). Within the industry, employment in motion picture and sound recording industries continued to trend down (-7,000) and has declined by 45,000 since May, reflecting the impact of labor disputes. Employment showed little change over the month in other major industries, including mining, quarrying, and oil and gas extraction; construction; manufacturing; wholesale trade; retail trade; financial activities; and other services. In September, average hourly earnings for all employees on private nonfarm payrolls rose by 7 cents, or 0.2 percent, to $33.88. Over the past 12 months, average hourly earnings have increased by 4.2 percent. In September, average hourly earnings of private-sector production and nonsupervisory employees rose by 6 cents, or 0.2 percent, to $29.06. (See tables B-3 and B-8.) The average workweek for all employees on private nonfarm payrolls was unchanged at 34.4 hours in September. In manufacturing, the average workweek was little changed at 40.1 hours, and overtime was unchanged at 3.1 hours. The average workweek for production and nonsupervisory employees on private nonfarm payrolls remained at 33.8 hours. (See tables B-2 and B-7.) The change in total nonfarm payroll employment for July was revised up by 79,000, from +157,000 to +236,000, and the change for August was revised up by 40,000, from +187,000 to +227,000. With these revisions, employment in July and August combined is 119,000 higher than previously reported. (Monthly revisions result from additional reports received from businesses and government agencies since the last published estimates and from the recalculation of seasonal factors.)
Employment Situation Summary Table A. Household data, seasonally adjusted Employment Situation Summary Table B. Establishment data, seasonally adjusted Employment Situation Frequently Asked Questions Employment Situation Technical Note Table A-1. Employment status of the civilian population by sex and age Table A-2. Employment status of the civilian population by race, sex, and age Table A-3. Employment status of the Hispanic or Latino population by sex and age Table A-4. Employment status of the civilian population 25 years and over by educational attainment Table A-5. Employment status of the civilian population 18 years and over by veteran status, period of service, and sex, not seasonally adjusted Table A-6. Employment status of the civilian population by sex, age, and disability status, not seasonally adjusted Table A-7. Employment status of the civilian population by nativity and sex, not seasonally adjusted Table A-8. Employed persons by class of worker and part-time status Table A-9. Selected employment indicators Table A-10. Selected unemployment indicators, seasonally adjusted Table A-11. Unemployed persons by reason for unemployment Table A-12. Unemployed persons by duration of unemployment Table A-13. Employed and unemployed persons by occupation, not seasonally adjusted Table A-14. Unemployed persons by industry and class of worker, not seasonally adjusted Table A-15. Alternative measures of labor underutilization Table A-16. Persons not in the labor force and multiple jobholders by sex, not seasonally adjusted Table B-1. Employees on nonfarm payrolls by industry sector and selected industry detail Table B-2. Average weekly hours and overtime of all employees on private nonfarm payrolls by industry sector, seasonally adjusted Table B-3. Average hourly and weekly earnings of all employees on private nonfarm payrolls by industry sector, seasonally adjusted Table B-4. Indexes of aggregate weekly hours and payrolls for all employees on private nonfarm payrolls by industry sector, seasonally adjusted Table B-5. Employment of women on nonfarm payrolls by industry sector, seasonally adjusted Table B-6. Employment of production and nonsupervisory employees on private nonfarm payrolls by industry sector, seasonally adjusted(1) Table B-7. Average weekly hours and overtime of production and nonsupervisory employees on private nonfarm payrolls by industry sector, seasonally adjusted(1) Table B-8. Average hourly and weekly earnings of production and nonsupervisory employees on private nonfarm payrolls by industry sector, seasonally adjusted(1) Table B-9. Indexes of aggregate weekly hours and payrolls for production and nonsupervisory employees on private nonfarm payrolls by industry sector, seasonally adjusted(1)