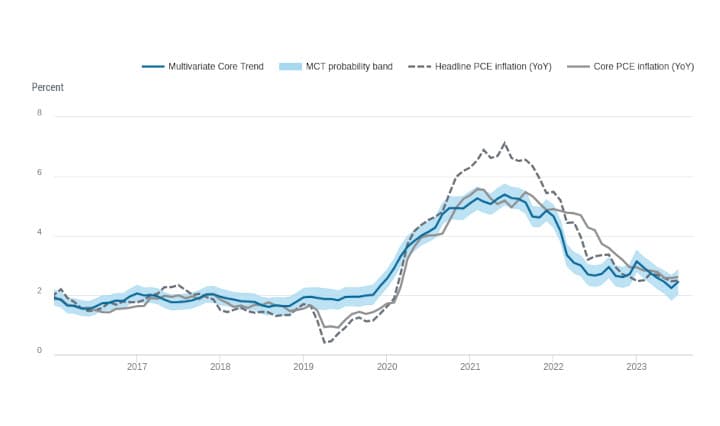
Inflation Alert! The Fed's preferred inflation measure continues to rise! Excluding food and energy, the PCE price index increased 4.2 percent from one year ago--still more than DOUBLE the Fed's 2% target. More fuel for rate hikes...

TLDRS:
- The Fed's preferred inflation gauge is still growing...
- Reminder, while banks have the liquidity fairy, 'we' get the promise of 2 more rate hikes this year, Atlanta Fed President Raphael Bostic yet again enrichens himself inappropriately from his position.
- To fix one end of their mandate (price stability) from the inflation problem they created, the Fed will continue sacrificing employment (the other end of their mandate) to bolster price stability by continuing to raise interest rates--causing further stress to businesses and households.
- I believe inflation is the match that has been lit that will light the fuse of our rocket.


https://www.bea.gov/news/2023/personal-income-and-outlays-july-2023

https://fred.stlouisfed.org/series/PCEPILFE

This is what 'transitory' growth looks like!

The increase in current-dollar personal income in July primarily reflected an increase in compensation that was partly offset by a decrease in personal current transfer receipts (table 3).
The $144.6 billion increase in current-dollar PCE in July reflected increases of $102.7 billion in spending for services and $41.9 billion in spending for goods (table 3). Within services, the largest contributors to the increase were financial services and insurance (led by portfolio management and investment advice services), housing and utilities (led by housing), food services and accommodation (led by food services), and health care (led by outpatient services). Within goods, the largest contributors to the increase were “other” nondurable goods (led by pharmaceuticals and recreational items), food and beverages (led by groceries), and recreational goods and vehicles (led by video, audio, photographic, and information processing equipment and media). Detailed information on monthly PCE spending can be found on Table 2.4.5U.
Personal outlays, the sum of PCE, personal interest payments, and personal current transfer payments, increased $153.8 billion in July (table 3). Personal saving was $705.6 billion in July and the personal saving rate—personal saving as a percentage of disposable personal income—was 3.5 percent (table 1).
Prices
From the preceding month, the PCE price index for July increased 0.2 percent (table 9). Prices for goods decreased 0.3 percent and prices for services increased 0.4 percent. Food prices increased 0.2 percent and energy prices increased 0.1 percent. Excluding food and energy, the PCE price index increased 0.2 percent. Detailed monthly PCE price indexes can be found on Table 2.4.4U.
From the same month one year ago, the PCE price index for July increased 3.3 percent (table 11). Prices for goods decreased 0.5 percent and prices for services increased 5.2 percent. Food prices increased 3.5 percent and energy prices decreased 14.6 percent. Excluding food and energy, the PCE price index increased 4.2 percent from one year ago.
Real PCE
The 0.6 percent increase in real PCE in July reflected an increase of 0.9 percent in spending on goods and an increase of 0.4 percent in spending on services (table 7). Within goods, the largest contributors to the increase were “other” nondurable goods (led by games, toys, and hobbies) and recreational goods and vehicles (led by video, audio, photographic and information processing equipment and media). Within services, the largest contributors to the increase were food services and accommodations (led by food services), financial services and insurance (led by portfolio management and investment advice services), and housing and utilities (led by utilities). Detailed information on monthly real PCE spending can be found on Table 2.4.6U.
Updates to Personal Income and Outlays
Estimates have been updated for April through June1. Revised and previously published changes from the preceding month for current-dollar personal income, and for current-dollar and chained (2012) dollar DPI and PCE, are provided below for May and June.