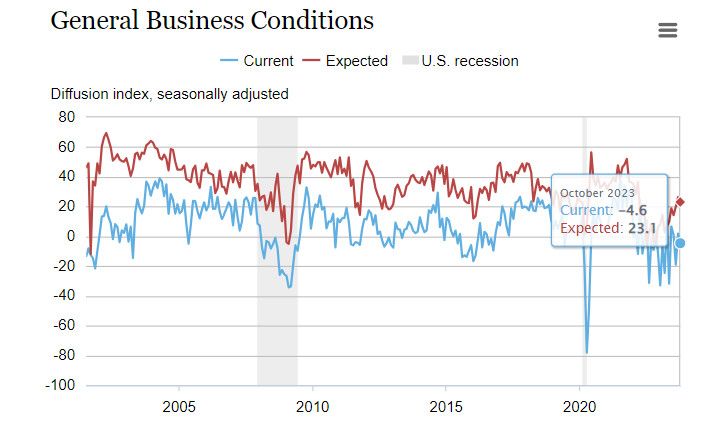
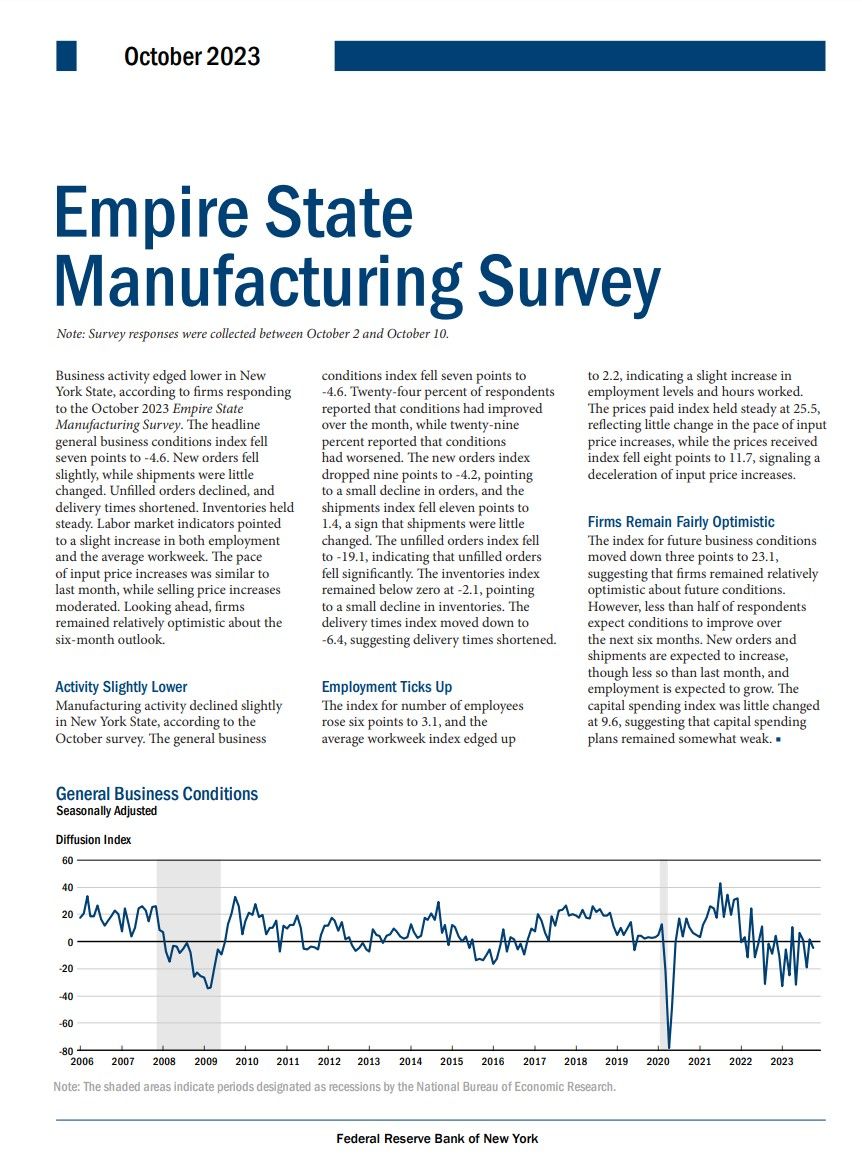
October Empire State Manufacturing Survey: the headline general business conditions index fell seven points to -4.6 (23.1 expected!)
Wut Mean?:
General Business Activity:
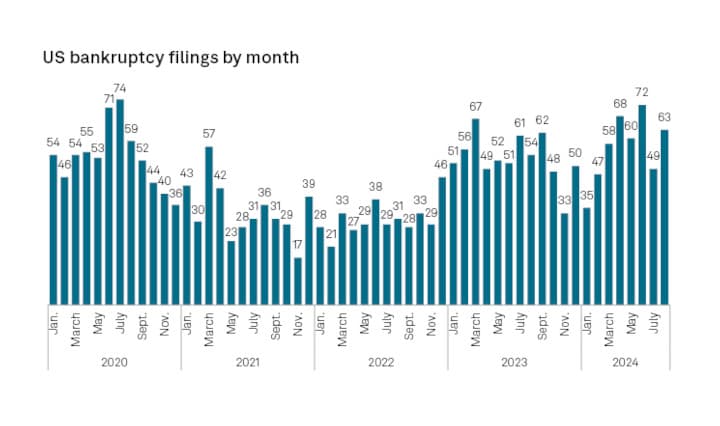
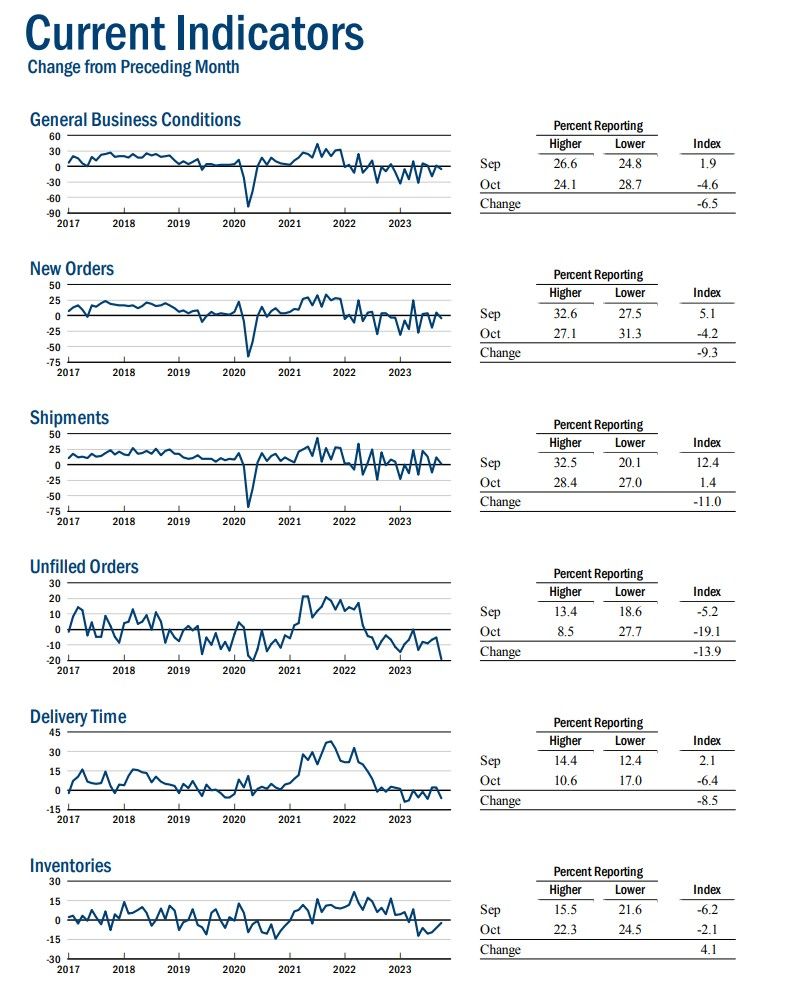
- Business activity in New York State saw a slight decline in October 2023, per the Empire State Manufacturing Survey.
- The general business conditions index dropped by seven points, settling at -4.6 (23.1 had been expected).
- While 24% of firms saw improved conditions over the month, 29% reported a deterioration.
Order & Shipments:
- New orders witnessed a minor decline with the index falling nine points to -4.2.
- Shipments remained mostly unchanged, with the index decreasing by eleven points to 1.4.
- Unfilled orders decreased significantly, as indicated by the -19.1 index value.
- Inventory levels slightly declined, reflected by the -2.1 index score.
- Delivery times shortened, shown by the -6.4 delivery times index.
Employment:
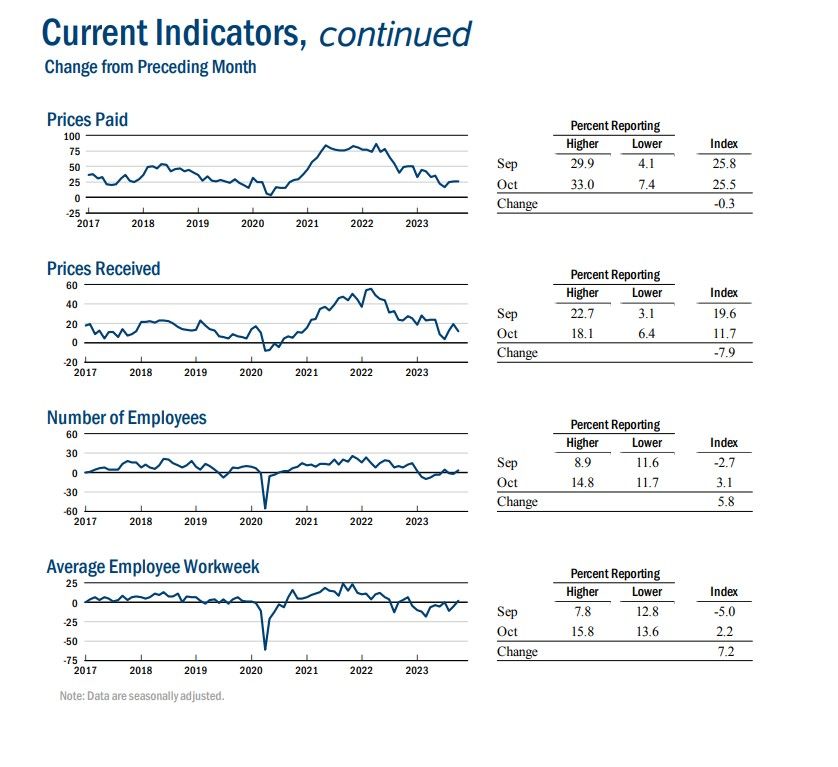
- Employment showed a positive trend, with the number of employees index increasing by six points to 3.1.
- The average workweek index rose slightly to 2.2, indicating a minor uptick in hours worked.
- Both items 'fuel' for inflation.
Pricing:
- The pace of input price increases remained consistent, with the prices paid index stable at 25.5.
- The prices received index dropped eight points to 11.7, indicating a slowdown in selling price increases.
- Again, more fuel for inflation--prices increases may be slowing but the pressure to lift prices higher via prices paid for inputs remains high.
Future Outlook:
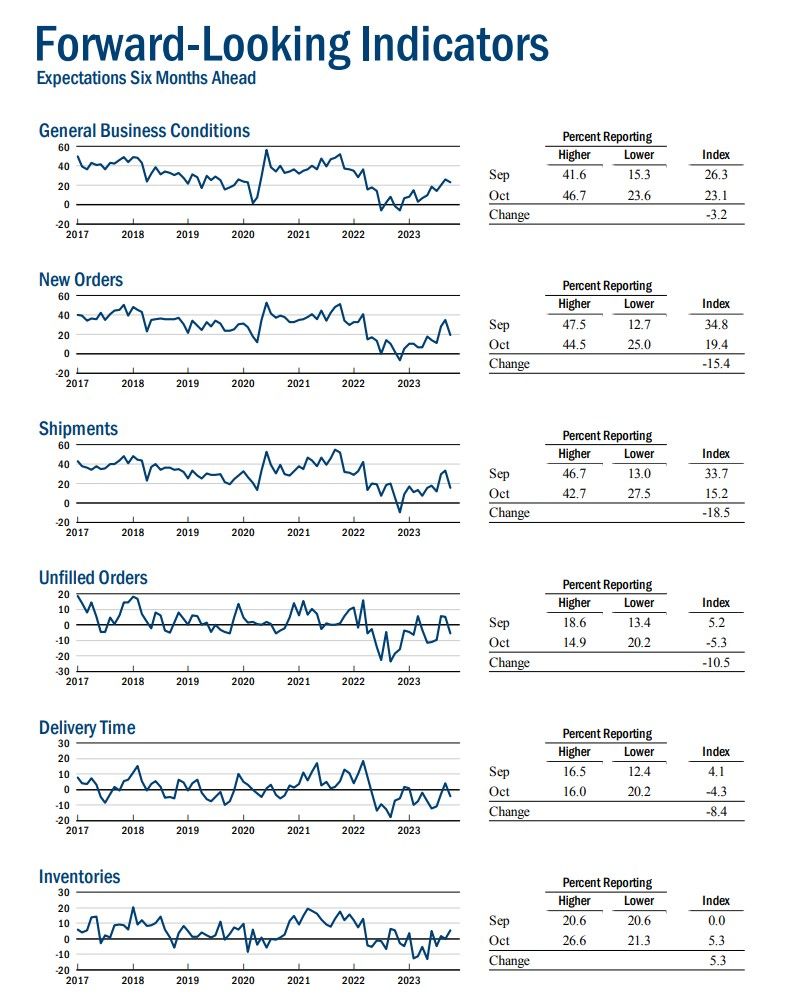
- Firms retain a relatively positive view of the future, although the index for future business conditions decreased slightly to 23.1.
- Fewer than 50% of respondents anticipate better conditions in the upcoming six months.
- Expectations are for increases in new orders and shipments, albeit at a reduced rate compared to previous months.
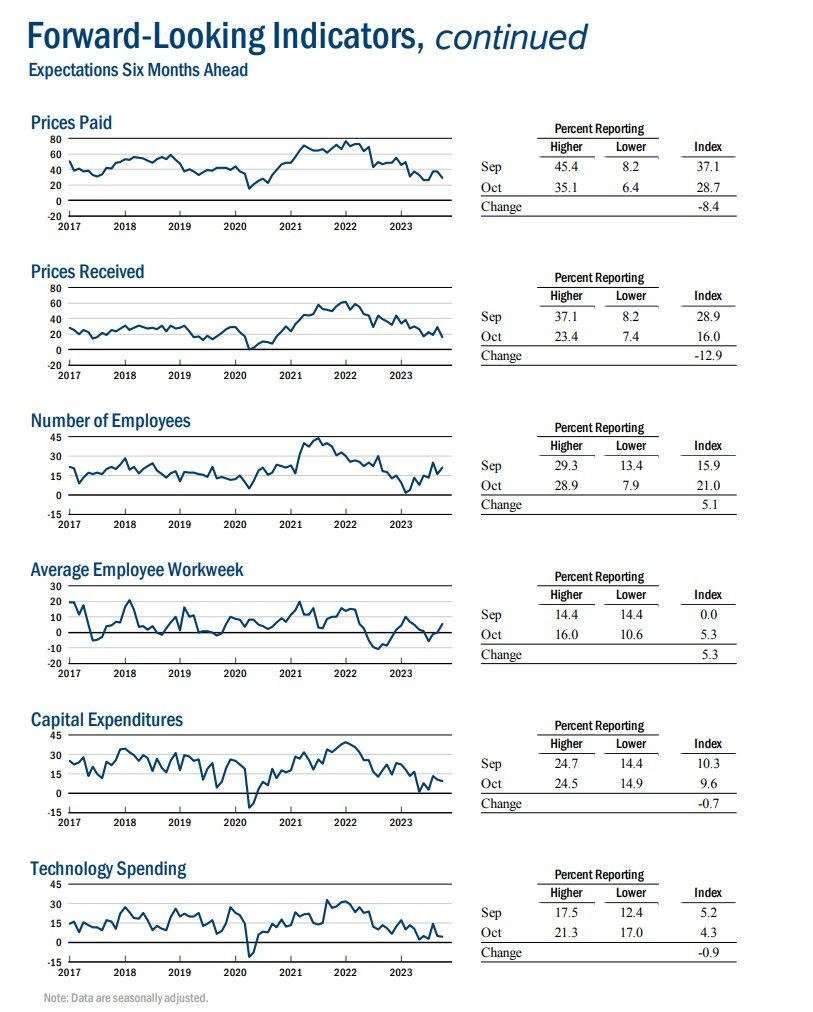
- Employment is projected to rise.
- Capital spending intentions remain somewhat weak, with the index barely changing at 9.6.
About Survey:
Participants from across the state in a variety of industries respond to a questionnaire and report the change in a variety of indicators from the previous month. Respondents also state the likely direction of these same indicators six months ahead. April 2002 is the first report, although survey data date back to July 2001.
The survey is sent on the first day of each month to the same pool of about 200 manufacturing executives in New York State, typically the president or CEO. About 100 responses are received. Most are completed by the tenth, although surveys are accepted until the fifteenth.
For demonstration only:
Sample survey
Respondents come from a wide range of industries from across the New York State. No one industry dominates the respondent pool.
The survey's main index, general business conditions, is not a weighted average of other indicators—it is a distinct question posed on the survey. Each index is seasonally adjusted when stable seasonality is detected.
Revisions
Each January, all data undergo a benchmark revision to reflect new seasonal factors.
Seasonal Adjustment
The Empire State Manufacturing Survey seasonally adjusts data based on the Census X-12 additive procedure utilizing a logistic transformation.
The "increase" and "decrease" percentage components of the diffusion indexes are each tested for seasonality separately and adjusted accordingly if such patterns exist. If no seasonality is detected, the component is left unadjusted. The "no change" component contains the residual, computed by subtracting the (adjusted) increase and decrease from 100. Seasonal factors are forecast in December for the upcoming year.
Data are adjusted using a logistic transformation. The not-seasonally adjusted series, expressed in decimal form (referred to as "p"), is transformed using the following equation:
X = log(p/(1-p))
The seasonal factor is then subtracted from X:
adjX = X - seasonal factor
The result is then transformed using the following equation:
SA Series = exponential(adjX)/(1+exponential(adjX))
Data definitions

TLDRS:
- Business activity in New York State saw a slight decline in October 2023, per the Empire State Manufacturing Survey.
- The general business conditions index dropped by seven points, settling at -4.6 (23.1 had been expected).
- Fewer than 50% of respondents anticipate better conditions in the upcoming six months.
- Employment showed a positive trend, with the number of employees index increasing by six points to 3.1.
- The average workweek index rose slightly to 2.2, indicating a minor uptick in hours worked.
- The pace of input price increases remained consistent.
- More inflation fuel!
- Reminder, while banks have the liquidity fairy, 'we' get the promise of more rate hikes this year, Atlanta Fed President Raphael Bostic yet again enrichens himself inappropriately from his position.
- To fix one end of their mandate (price stability) from the inflation problem they created, the Fed will continue sacrificing employment (the other end of their mandate) to bolster price stability by continuing to raise interest rates--causing further stress to businesses and households.
- I believe inflation is the match that has been lit that will light the fuse of our rocket.