Inflation Alert! New report highlights survey data that shows that child care prices outpaced inflation in 2021 for the third consecutive year.
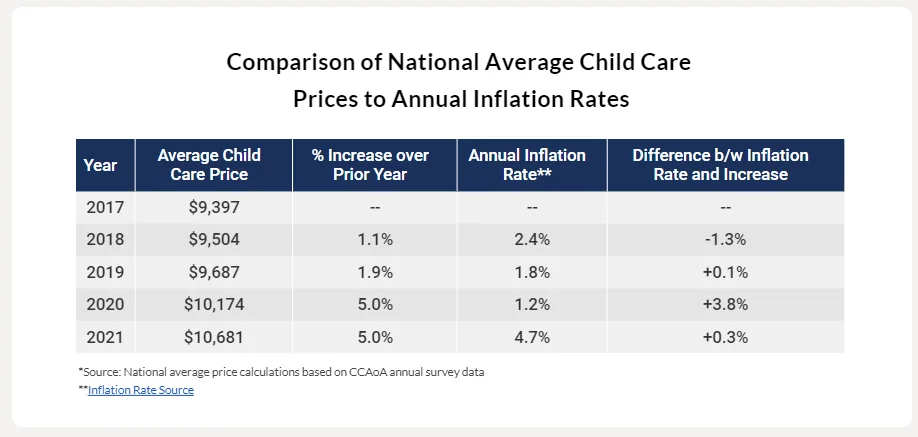
Inflation Alert! New report highlights survey data that shows that child care prices outpaced inflation in 2021 for the third consecutive year. In 2021, the average annual inflation rate was higher than usual at 4.7%, but child care prices rose by an average of 5% when compared to 2020 prices.
Child Care Prices Continue To Outpace Inflation
CCAoA’s analysis found that increases in the price of child care have exceeded the average annual rate of inflation for the past three years. The table below shows that in 2019 and 2020, child care prices exceeded the inflation rate by less than 1 percentage point and nearly 4 percentage points, respectively.
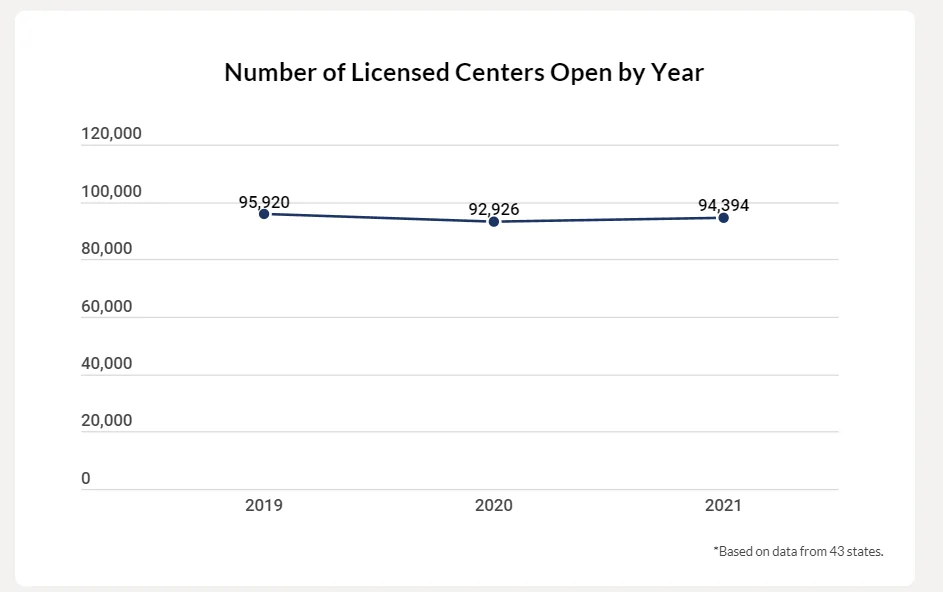
Our child care system continues to experience multiple crises, with families finding it difficult to locate reliable child care that they can afford. Between 2020 and 2021, the overall supply of child care programs continued to decrease, leaving families with even fewer options than before the pandemic.
Child care prices rose by an average of 5% when compared to 2020 prices. This means that child care prices exceeded historically high inflation by 0.3 percentage points and, thus, families with children are more likely to struggle to afford child care on top of essentials such as food, housing and transportation.
This year, CCAoA is featuring longitudinal supply data to increase user understanding regarding how the supply of child care has changed since 2019, prior to the start of the COVID-19 pandemic. Nationally, we found that while there was an increase in the number of child care centers from 2020 to 2021, the total number of centers remains slightly lower than the number open in 2019.
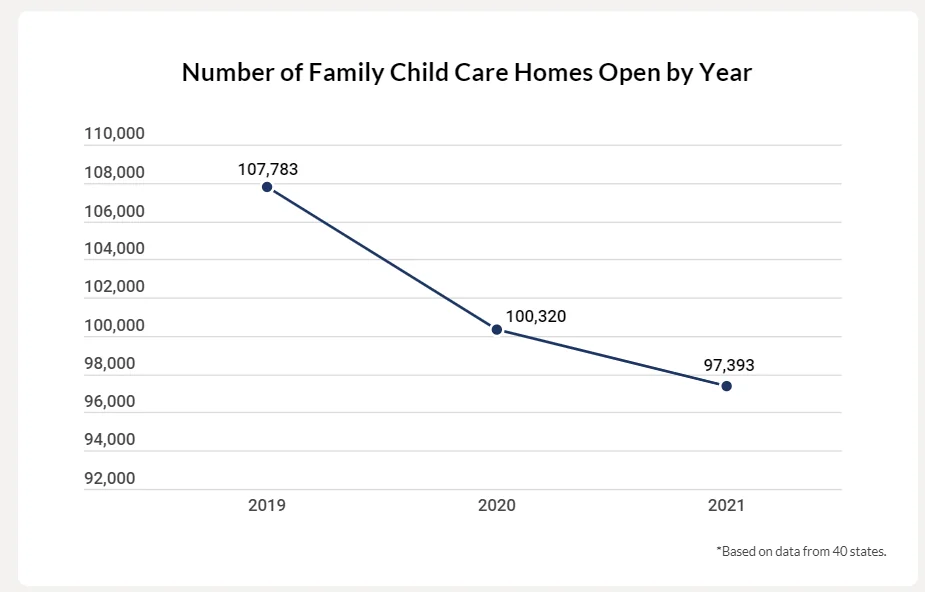
Even before the COVID-19 pandemic, the supply of FCC homes was decreasing. This is an alarming trend because FCC homes are an affordable option for many families. FCC homes are often the only choice for families, especially in rural communities.
CCAoA’s Child Care Affordability Analysis found that in 2021:
- The national average price of child care was around $10,600 annually. This would comprise 10% of a married-couple family’s average annual income and 35% of a single parent’s income.
- The increase in child care prices slightly outpaced inflation, which was much higher than the inflation rate in prior years.
- In most states, the price of child care for two children exceeded annual housing payments by 28% to over 100%.
- Similarly, the price of child care for an infant in a center exceeded annual in-state tuition at a public university in 34 states.
- Child care for two children in a center would cost a child care workforce professional anywhere from 56% to over 100% of annual income.
- Child care was more expensive than most other household expenses such as housing and health care in all U.S. regions.
National Child Care Price Estimates are above the Recommended 7% of Household Income
The average of each methodology described below (both provider types and age groups), produces a national annual average price of child care of approximately $10,400 to $10,800. While readers should take caution when interpreting these numbers because the nation’s child care landscape varies dramatically from state to state, comparing these figures to the national median income for married couples with children under 18 highlights that it would take more than 10% of household income to cover the child care prices for one child. This is more than the U.S. Department of Health and Human Services recommendation that child care should cost no more than 7% of a household’s income. The situation is more dire for single parents, as the average national price of child care comprises 35% of the median household income for single-parent families.
Methodology
The information found in the state fact sheets comes from a variety of sources. In January 2022, CCAoA surveyed state Child Care Resource and Referral (CCR&R) agencies or other key child care stakeholders in each state (for example, state agencies responsible for administering the federally-funded Child Care and Development Block Grant). The survey covered the following topics: child care supply and capacity, quality rating and improvement systems (QRIS), CCR&R services and annual child care prices. Respondents were asked to complete the survey based on data as of December 2021. Data from the survey not included here, such as those on price, will be presented in upcoming CCAoA reports.
Some states have more data points present in their Child Care Landscape Analysis than others. Some states are unable to answer some survey questions because of differing definitions or not collecting certain data points. Child care supply and QRIS data were gathered from public databases for the following states: Alabama, California, District of Columbia, Mississippi, New Jersey, New Mexico, Texas and Wyoming.
What Mean?
Nearly two-thirds of consumer spending goes to services. And they’re now the driver of inflation, with childcare being shown to outpace inflation and feeding into the inflation we are seeing now.
How is this related to GameStop? 'GameStop Daycare' Is A Thing and it is untenable situations like this that force parents into these positions.
In the future, given more and more brick and mortar GameStop's are going 'high-tech' it would be cool to see partnerships with local libraries to help delight and educate the kids (while hopefully being able to take advantage of some sweet government rebates for helping bridge a dire need?)