Financial Stability Report: Leverage at hedge funds reached its highest level since data became available.
The Financial Stability Report summarizes the Federal Reserve Board's framework for assessing the resilience of the U.S. financial system and presenting the Board's current assessment.
By publishing this report, the Board intends to promote public understanding and increase transparency and accountability for the Federal Reserve’s views on this topic.
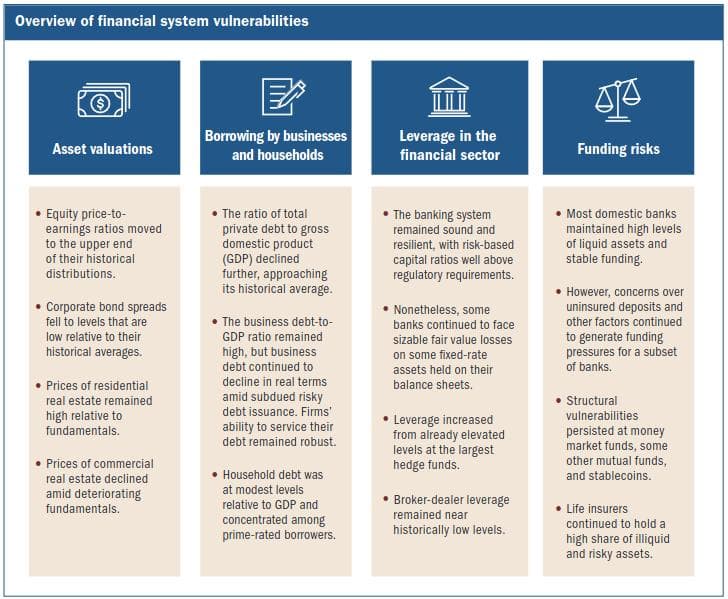
This report reviews vulnerabilities affecting the stability of the U.S. financial system related to valuation pressures, borrowing by businesses and households, financial-sector leverage, and funding risks.
It also highlights several near-term risks that, if realized, could interact with these vulnerabilities.
A summary of the developments in the four broad categories of vulnerabilities since the
October 2023 Financial Stability Report":
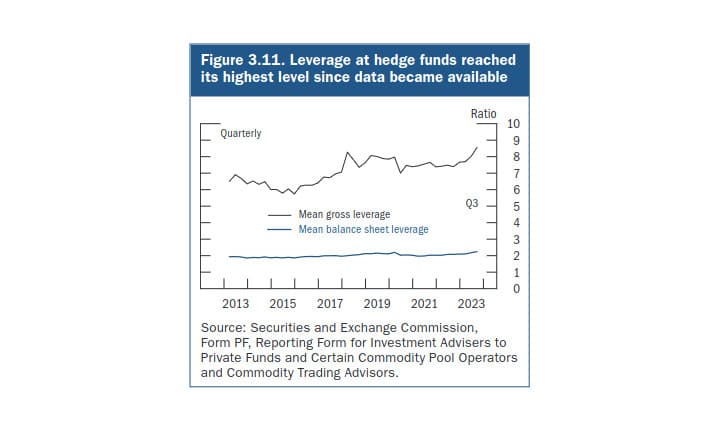
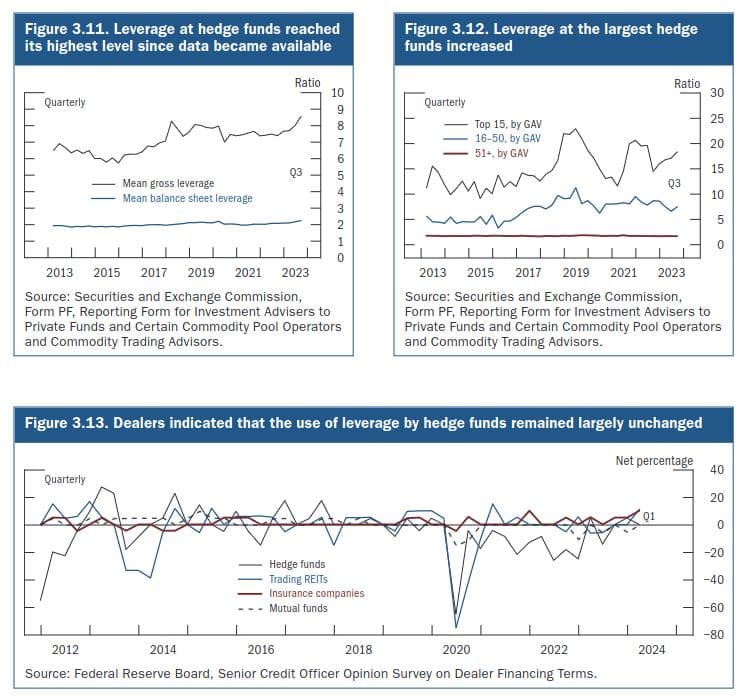
Leverage at hedge funds reached its highest level in available data
Comprehensive data collected through the U.S. Securities and Exchange Commission’s (SEC) Form PF indicated that measures of leverage averaged across all hedge funds increased further in the third quarter of 2023, reaching the highest level observed since the beginning of data availability.
Leverage increased when measured using either average on-balance-sheet leverage (blue line in figure 3.11)—which captures financial leverage from secured financing transactions, such as repurchase agreements and margin loans, but does not capture leverage embedded through derivatives—or average gross leverage of hedge funds (black line in figure 3.11), a broader measure that also incorporates off-balance-sheet derivatives exposures.
Leverage at the largest funds was significantly higher, with the average on-balance-sheet leverage of the top 15 hedge funds by gross asset value rising in the third quarter of 2023 to about 18-to-1 (figure 3.12). These high levels of leverage were facilitated, in part, by low haircuts on Treasury collateral in some markets where many funds obtain short-term financing.
More recent data from the March SCOOS suggested that hedge fund leverage flattened out as the use of financial leverage by hedge funds remained largely unchanged between mid-November 2023 and mid-February 2024 (figure 3.13).
As of the third quarter of 2023, data from Form PF showed that net repurchase agreement borrowing, one measure of the Treasury cash-futures basis trade, grew to near historic highs, while data from the Commodity Futures Trading Commission (CFTC) Traders in Financial Futures report also showed leveraged funds’ short Treasury futures positions were near historical highs.
Meanwhile, indicators based on data from the first quarter of 2024, including leveraged funds’ short Treasury futures positions and a basis trade proxy from Treasury TRACE, suggested the basis trade might have declined from its levels at the end of 2023 but remained elevated.
This highly leveraged trade, which involves shorting a Treasury futures contract and purchasing a Treasury note deliverable into that contract, with the note typically financed in bilateral repurchase agreement markets, was popular among hedge funds between mid-2018 and February 2020, and its subsequent unwinding contributed to the Treasury market turmoil in March 2020.
Asset valuations increased to elevated levels relative to fundamentals
Since the October report, equity valuations increased further. Valuations in corporate bond markets also appeared stretched as corporate credit spreads, the difference in yields on corporate bond and yields on similar-maturity Treasury securities, narrowed since the previous report, falling to levels in the lower range of their historical distributions.
Liquidity in short-term Treasury markets remained low by historical standards, although market liquidity was consistent with elevated measures of interest rate volatility. Nonetheless, Treasury market liquidity conditions could amplify the impact of shocks on asset valuations.
Residential real estate valuations remained near the peak levels seen in the mid-2000s. CRE market conditions continued to deteriorate, especially for the office sector, and prices continued to decline against a backdrop of high vacancy rates and weakening rents.
Business debt vulnerabilities remain moderate relative to historical levels
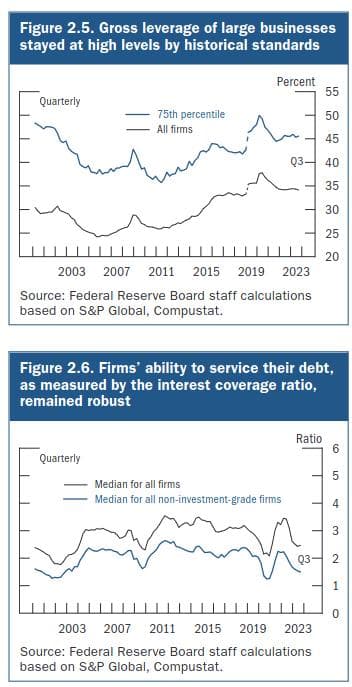
Gross leverage—the ratio of debt to assets—of all publicly traded nonfinancial firms edged down slightly in the third quarter of 2023 but stayed high by historical standards (figure 2.5). Net leverage—the ratio of debt less cash to total assets—also inched down among all large publicly traded businesses, although it remained at an elevated level.
Overall, firms remained well placed to service their debt, despite some emerging signs of weakness among riskier firms. After declining from its peak reached post-pandemic, the median ICR stayed largely flat through the first three quarters of 2023 owing to resilient earnings (figure 2.6). In addition, the pass- through of higher interest rates to firms’ borrowing costs remained moderate, reflecting record fixed-rate debt issuance by firms during the pandemic when interest rates were low. Corporate earnings remained strong through the first three quarters of 2023.
However, signs of stress in debt servicing and deterioration in credit quality continued to emerge. For example, the 12-month trailing corporate bond default rate moved up further, on net, since the October report and stood near the median of its historical distribution. Expectations of year-ahead defaults remained somewhat elevated relative to their history.
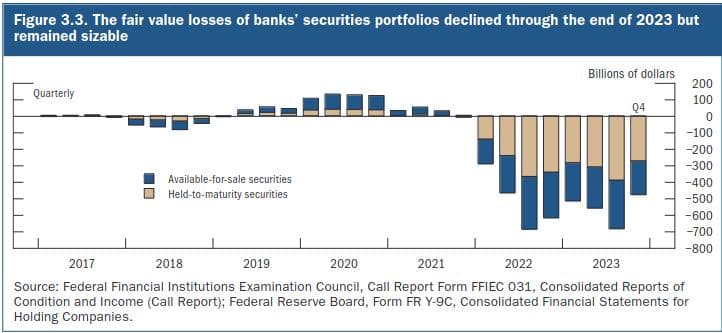
Higher interest rates continued to affect the fair value of banks’ holdings of fixed-rate assets.
At the end of the fourth quarter of 2023, banks had declines in fair value of $204 billion in available-for-sale (AFS) portfolios and $274 billion in held-to-maturity portfolios.
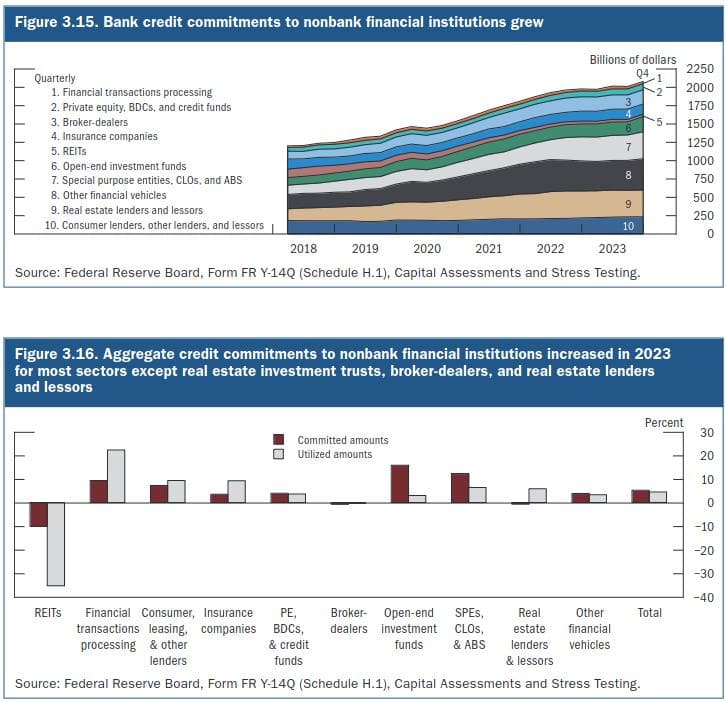
Bank lending to nonbank financial institutions increased
After remaining flat in the third quarter of 2023, bank credit commitments to NBFIs resumed growing in the fourth quarter (figure 3.15). The year-over-year growth rate in committed amounts was largely due to loans to open-end investment funds and special purpose entities and securitization vehicles, both of which grew about 15 percent over the course of 2023 (figure 3.16).
Vulnerabilities from funding risks remained notable, reflecting challenges at some banks and structural vulnerabilities in other sectors engaged in liquidity transformation
Prime MMFs and similar cash-management vehicles remained a prominent source of vulnerability given their susceptibility to runs and the significant role they play in short-term funding markets.
In addition, some cash-management vehicles, including retail prime MMFs, government MMFs, and short-term investment funds, maintained stable net asset values (NAVs) but may face difficulties doing so because they hold assets in their portfolios whose valuations are vulnerable to sharp movements in interest rates.
Some open-end bond mutual funds remained susceptible to large redemptions because they
must allow shareholders to redeem every day even though the funds hold assets that can face losses and become illiquid amid stress. Life insurers continued to face funding risk owing to their reliance on a higher-than-average share of nontraditional liabilities in combination with an increasing share of illiquid and risky assets on their balance sheets.

TLDRS
- The Financial Stability Report by the Federal Reserve assesses the resilience of the U.S. financial system. It examines vulnerabilities such as valuation pressures, business and household borrowing, financial-sector leverage, and funding risks.
- The report notes an increase in leverage among hedge funds to the highest levels on record as of the third quarter of 2023, driven by low collateral requirements and high on-balance-sheet and gross leverage measurements. Despite a flattening out from November 2023 to February 2024, leverage remains high.
- Asset valuations, including equity and corporate bond markets, have risen to levels considered stretched relative to fundamentals, with liquidity in short-term Treasury markets remaining low. Real estate valuations are near peak levels from the mid-2000s, and commercial real estate, particularly office sectors, faces deteriorating conditions.
- Business debt levels are described as moderate, with both gross and net leverage ratios remaining high but manageable due to strong corporate earnings and moderate impact from higher interest rates. Meanwhile, bank lending to non-bank financial institutions saw growth in the fourth quarter of 2023.
- Funding risks are highlighted as significant vulnerabilities, especially among prime money market funds (MMFs), open-end bond mutual funds, and life insurers, which face potential liquidity and redemption challenges due to their asset-liability structures and exposure to illiquid investments.
- What does it mean for GameStop? High leverage can exacerbate market volatility, as funds may be forced to quickly liquidate positions to meet margin calls or reduce risk and with equity and corporate bond markets considered stretched relative to fundamentals, any adjustment to more realistic valuations can lead to increased market volatility– all this hedge fund leverage with stretched valuations is a powder keg!