FDIC Quarterly Banking Profile: Unrealized losses on securities totaled $516.5 billion in the first quarter, an increase of $38.9 billion (8.2 percent) from fourth quarter 2023.
The Quarterly Banking Profile is a quarterly publication that provides the earliest comprehensive summary of financial results for all FDIC-insured institutions.
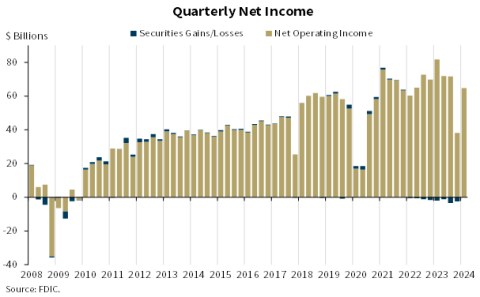
Reports from 4,568 commercial banks and savings institutions insured by the Federal Deposit Insurance Corporation (FDIC) report aggregate net income of $64.2 billion in first quarter 2024, an increase of $28.4 billion (79.5 percent) from the prior quarter.
A large decline in noninterest expense because of several substantial, non-recurring items recognized by large banks in the prior quarter, as well as higher noninterest income and lower provision expenses this quarter, contributed to the quarterly increase.
Complete QBP - PDF
- Chart 1. Quarterly Net Income
- Chart 2. Quarterly Net Interest Margin
- Chart 3. Change in Quarterly Credit Loss Provisions
- Chart 4. Quarterly Change in Loan Balances
- Chart 5. Quarterly Change in Domestic Deposits
- Chart 6. Noncurrent Loan Rate and Quarterly Net Charge-Off Rate
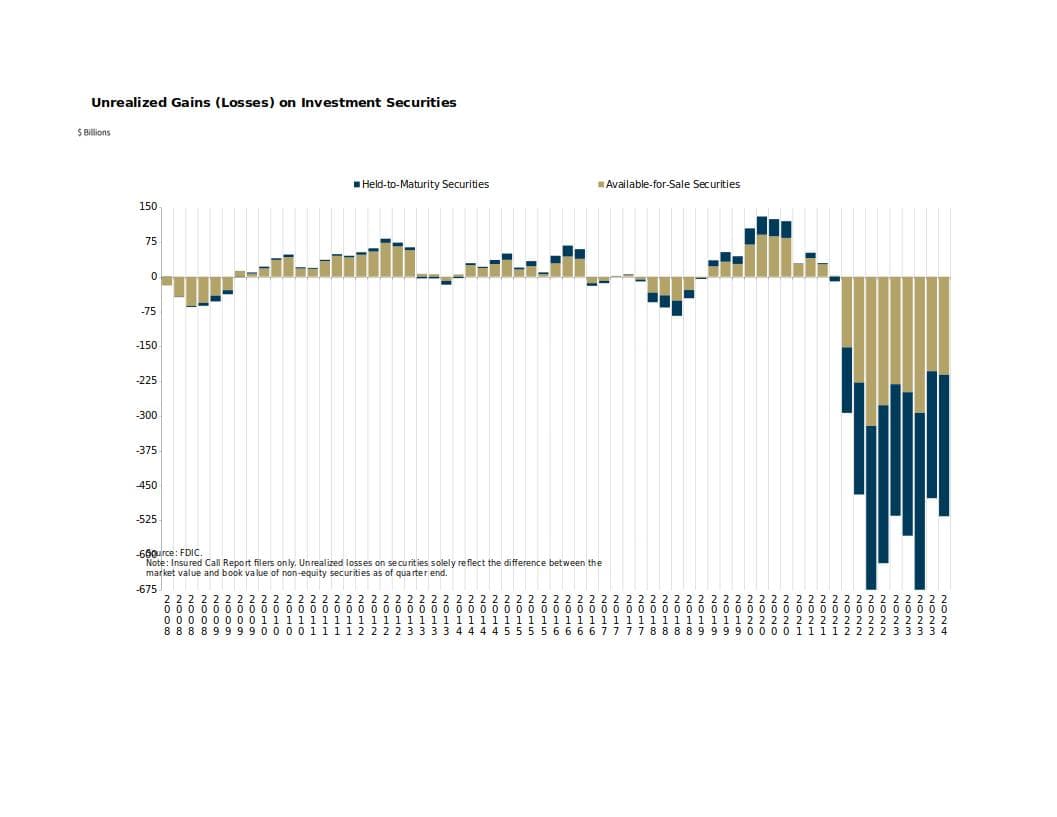
- Chart 7. Unrealized Gains (Losses) on Investment Securities
- Chart 8. Number and Assets of Banks on the "Problem Bank List"
- Quarterly Change in Asset Funding
- Quarter-Over-Quarter Change in Income
- Reserve Coverage Ratio
- Quarterly Change in Loan Yields and Deposit Costs
- Quarterly Credit Loss Provisions
- Loans and Securities > 3 Years as a Percent of Total Assets
- Bank Non-Owner Occupied, Nonfarm Nonresidential Loan Past-Due and Nonaccrual Rates by Asset Size
- DIF Reserve Ratio and Balance
Community Bank Performance Charts and Data - Excel
- Chart 1. Contributors to the Year-Over-Year Change in Income
- Chart 2. Net Interest Margin
- Chart 3. Change in Loan Balances and Unused Commitments
- Chart 4. Noncurrent Loan Rates for FDIC-Insured Community Banks
Deposit Insurance Fund Trends Charts and Data - Excel
- DIF Reserve Ratios
- Number of FDIC-Insured Institutions on the "Problem Bank List"
- Assets of FDIC-Insured Institutions on the "Problem Bank List"
Highlights from the First Quarter 2024 Quarterly Banking Profile
The Industry’s Net Income Increased From the Prior Quarter, Driven By Lower Noninterest Expense, Provision Expenses, and Higher Noninterest Income:
First quarter net income for the 4,568 FDIC-insured commercial banks and savings institutions increased by $28.4 billion (79.5 percent) from the prior quarter to $64.2 billion. A large decline in noninterest expense (down $22.5 billion, or 13.3 percent) was the primary cause of the increase in net income. A decline in the expense related to the special assessment accounted for more than half of the decline in noninterest expense. Higher noninterest income (up $10.3 billion, or 15.2 percent) and lower provision expenses (down $4.3 billion, or 17.3 percent) also contributed to the quarterly increase.
The banking industry reported an aggregate return-on-assets ratio (ROA) of 1.08 percent in first quarter 2024, up from 0.61 percent in fourth quarter 2023 but down from 1.36 percent in first quarter 2023.
Community Bank Net Income Increased Quarter Over Quarter:
Quarterly net income for the 4,128 community banks insured by the FDIC was $6.3 billion in the first quarter, an increase of $363.2 million (6.1 percent) from fourth quarter 2023. Lower realized losses on the sale of securities and lower noninterest and provision expenses more than offset lower noninterest and net interest income. The community bank pretax ROA increased six basis points from one quarter ago to 1.13 percent.
The Net Interest Margin Fell For the Second Consecutive Quarter:
The industry’s net interest margin (NIM) declined ten basis points to 3.17 percent in the first quarter. NIM declined as funding costs continued to increase while the yield on earning assets declined during the quarter. The industry’s first-quarter NIM was seven basis points below the pre-pandemic average NIM.1 The community bank NIM of 3.23 percent also declined quarter over quarter; it is down 12 basis points from the prior quarter and 41 basis points from its pre-pandemic average.
Asset Quality Metrics Remained Generally Favorable With the Exception of Material Deterioration in Credit Card and Commercial Real Estate (CRE) Portfolios:
Loans that were 90 days or more past due or in nonaccrual status increased to 0.91 percent of total loans, up five basis points from the prior quarter and 16 basis points from the year-ago quarter. The quarterly increase was led by commercial and industrial loans and non-owner-occupied CRE loans. The noncurrent rate for non-owner occupied CRE loans of 1.59 percent is now at its highest level since fourth quarter 2013, driven by office portfolios at the largest banks. Despite the recent increases, the industry’s total noncurrent ratio remains 37 basis points below the pre-pandemic average of 1.28 percent.
The industry’s net charge-off rate of 0.65 percent was unchanged from the prior quarter but was 24 basis points higher than a year ago. This ratio remains 17 basis points above the pre-pandemic average. The credit card net charge-off rate was 4.70 percent in the first quarter, up 55 basis points quarter over quarter and the highest rate since third quarter 2011.
Loan Balances Declined Modestly From the Prior Quarter, but Increased From a Year Ago:
Total loan and lease balances declined $34.8 billion (0.3 percent) from the previous quarter. The decline was driven by lower credit card loans (down $35.7 billion, or 3.2 percent) and auto loans (down $7.6 billion, or 1.4 percent), primarily at large banks.
Total loan and lease balances increased by $205.2 billion (1.7 percent) from the prior year. This increase was led by credit card loans (up $98.3 billion, or 10.0 percent), 1-4 family residential loans (up $59.7 billion, or 2.4 percent), and nonfarm, nonresidential commercial real estate loans (up $42.6 billion, or 2.4 percent). Almost 85 percent of banks reported annual loan growth.
Community banks reported a 0.9 percent increase in loan and lease balances from the previous quarter and a 7.1 percent increase from the prior year. Growth in nonfarm, nonresidential CRE loans and 1-4 family residential mortgage loans drove both the quarterly and annual increases in loan and lease balances.
Domestic Deposits Increased For the Second Consecutive Quarter:
Domestic deposits increased $190.7 billion (1.1 percent) from fourth quarter 2023, marking a second consecutive quarterly increase. Growth in transaction accounts led the increase (up $247.2 billion, or 4.0 percent), offsetting a decline in savings deposit balances (down $125.5 billion, or 1.5 percent). Estimated insured deposits increased $114.9 billion (1.1 percent), while estimated uninsured domestic deposits increased $63.3 billion (0.9 percent) during the quarter, the first reported quarterly increase since fourth quarter 2021. After seven consecutive quarters of growth, brokered deposits declined $10.2 billion (0.8 percent) from the prior quarter.
The Deposit Insurance Fund Reserve Ratio Increased Two Basis Points to 1.17 Percent:
In the first quarter, the Deposit Insurance Fund (DIF) balance increased by $3.5 billion to $125.3 billion, primarily driven by assessment revenue. The reserve ratio increased two basis points during the quarter to 1.17 percent.
The Total Number of Insured Institutions Declined:
The total number of FDIC-insured institutions declined by 19 during the quarter to 4,568. One bank opened, four banks did not file a Call Report, and 16 institutions merged with other banks during the quarter.
Unrealized Losses on Securities Increased From the Previous Quarter to $516.5 Billion
Unrealized losses on securities totaled $516.5 billion in the first quarter, an increase of $38.9 billion (8.2 percent) from fourth quarter 2023. Higher unrealized losses on residential mortgage-backed securities accounted for almost 95 percent of the total decrease. Mortgage rates increased in the first quarter, which placed downward pressure on the underlying values of such investments.
The Number of Problem Banks Increased
The number of banks on the FDIC’s “Problem Bank List” increased from 52 to 63. 5 Total assets held by problem banks rose $15.8 billion to $82.1 billion. Problem banks represent 1.4 percent of total banks, which is within the normal range for non-crisis periods of 1 to 2 percent of all banks.

TLDRS:
- FDIC-Insured Institutions Reported Net Income of $64.2 Billion
- Net Income Increased From the Prior Quarter, Driven By Lower Noninterest Expense, Provision Expenses, and Higher Noninterest Income
- Community Bank Net Income Increased Quarter Over Quarter
- The Net Interest Margin Fell For the Second Consecutive Quarter
- Asset Quality Metrics Remained Generally Favorable With the Exception of Material Deterioration in Credit Card and Commercial Real Estate Portfolios
- Loan Balances Declined Modestly From the Prior Quarter, but Increased From a Year Ago
- Domestic Deposits Increased For the Second Straight Quarter
- The Deposit Insurance Fund Reserve Ratio Increased Two Basis Points to 1.17 Percent
- The number of banks on the FDIC’s “Problem Bank List” increased from 52 to 63. 5 Total assets held by problem banks rose $15.8 billion to $82.1 billion.
- Problem banks represent 1.4 percent of total banks, which is within the normal range for non-crisis periods of 1 to 2 percent of all banks.
- The noncurrent rate for non-owner occupied CRE loans of 1.59 percent is now at its highest level since fourth quarter 2013, driven by office portfolios at the largest banks.
- The credit card net charge-off rate was 4.70 percent in the first quarter, up 55 basis points quarter over quarter and the highest rate since third quarter 2011.
- Unrealized losses on securities totaled $516.5 billion in the first quarter, an increase of $38.9 billion (8.2 percent) from fourth quarter 2023.