BLS: Unemployment holds at 3.9% with a minimal shift in jobless figures. Hourly earnings climb to $34.00, more fuel for the inflation fire!

Highlights:
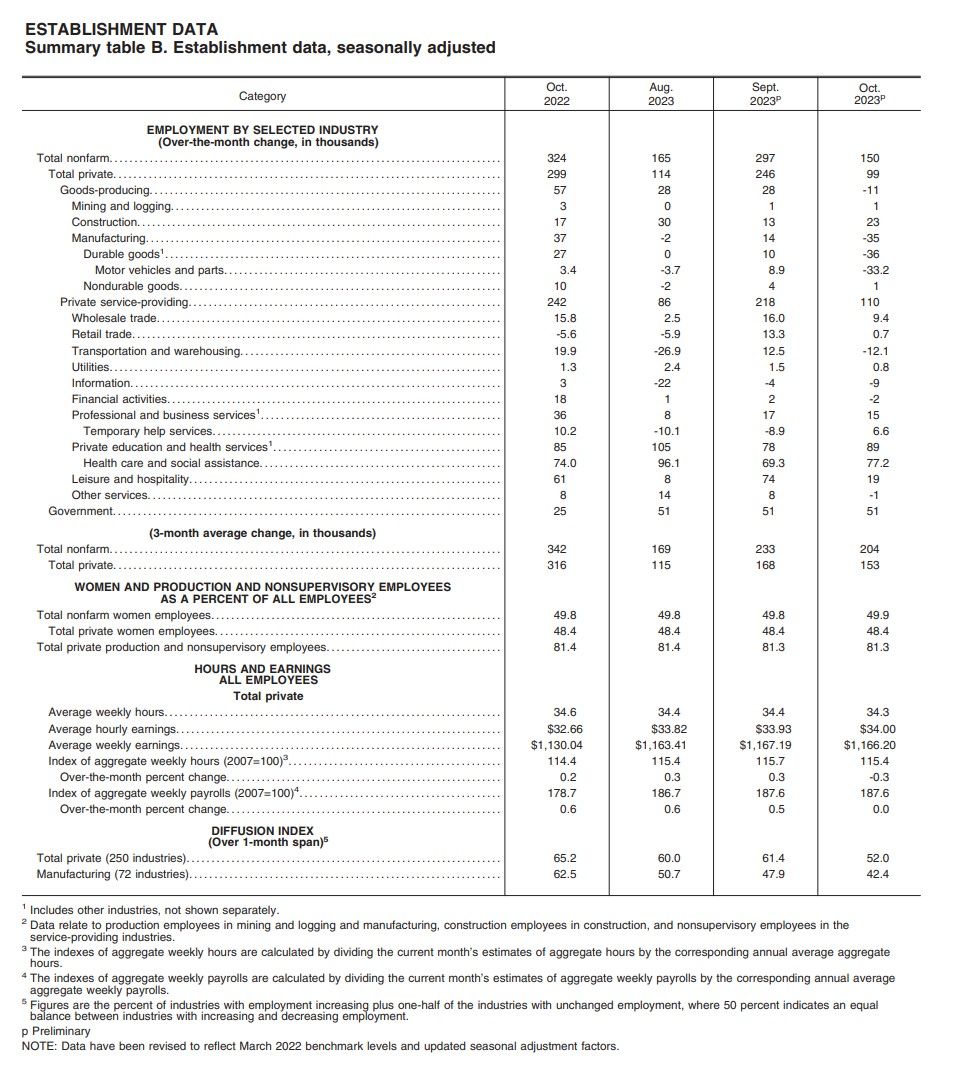
- Total nonfarm payroll employment increased by 150,000 in October.
- The unemployment rate remained stable at 3.9%.

- Job gains were seen in health care, government, and social assistance.
- Employment declined in manufacturing due to strike activity.
- The household survey showed little change in the unemployment rate (3.9%) and number of unemployed persons (6.506 million).

- Unemployment rates among major worker groups showed little change in October: for adult men (3.7 percent), adult women (3.3 percent), teenagers (13.2 percent), Whites (3.5 percent), Blacks (5.8 percent), Asians (3.1 percent), and Hispanics (4.8 percent)
- The number of permanent job losers increased by 164,000 to 1.6 million.

- The number of long-term unemployed (jobless for 27 weeks or more) ticked up slightly to almost 1.3 million.

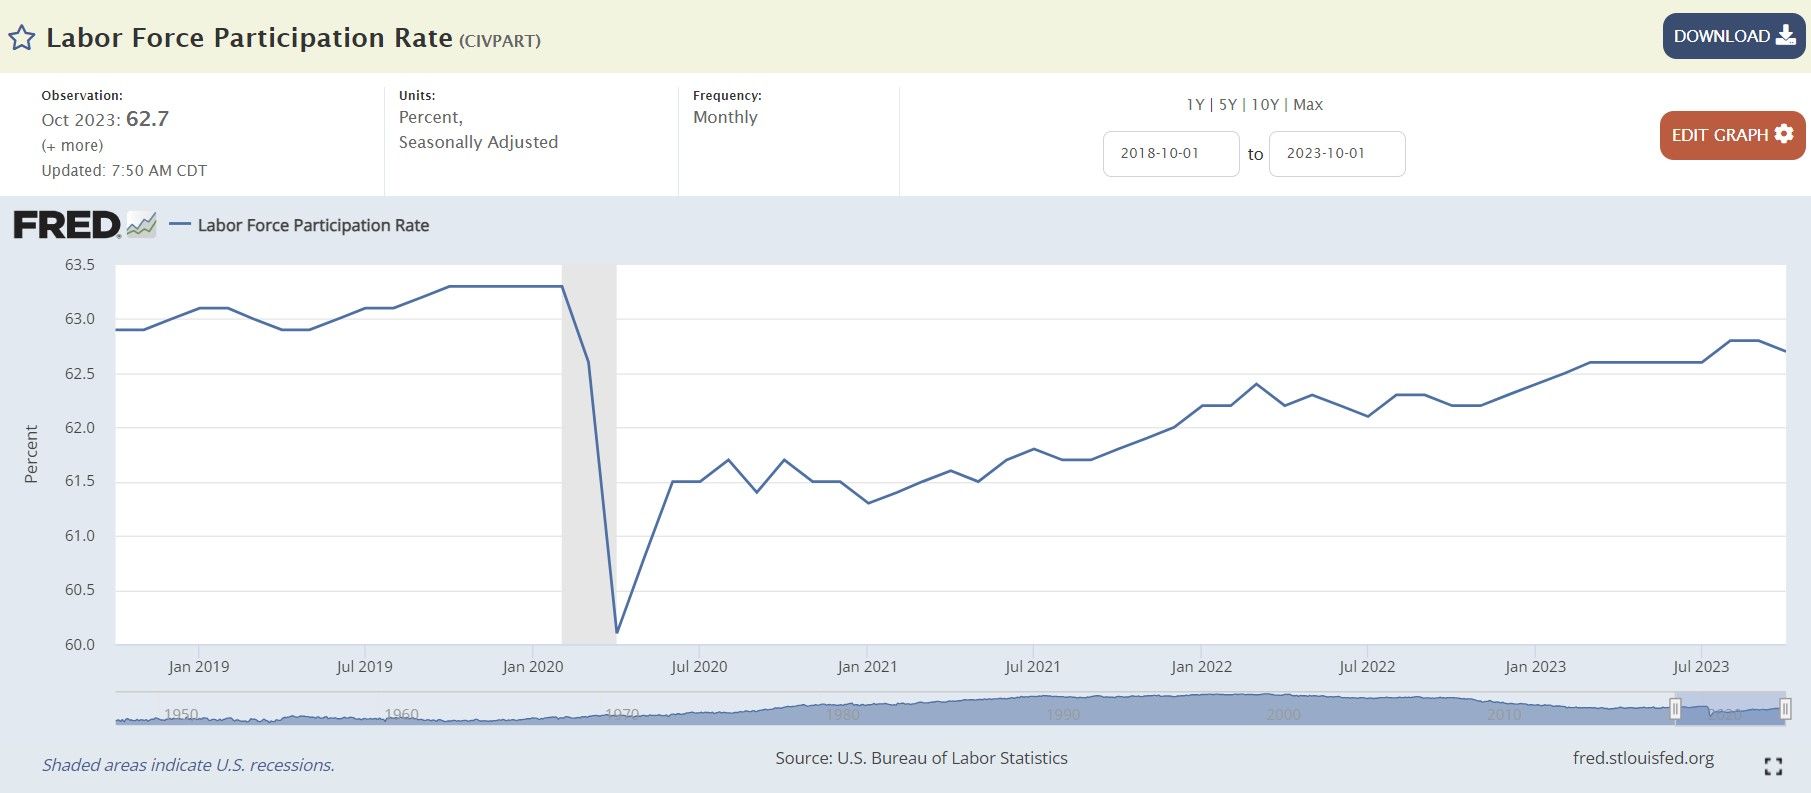
- Labor force participation rate ticked down slightly to 62.7%
- employment-population ratio ticked down to 60.2%

- The number of persons employed part-time for economic reasons was up over 200k folks from September to 4.3 million.

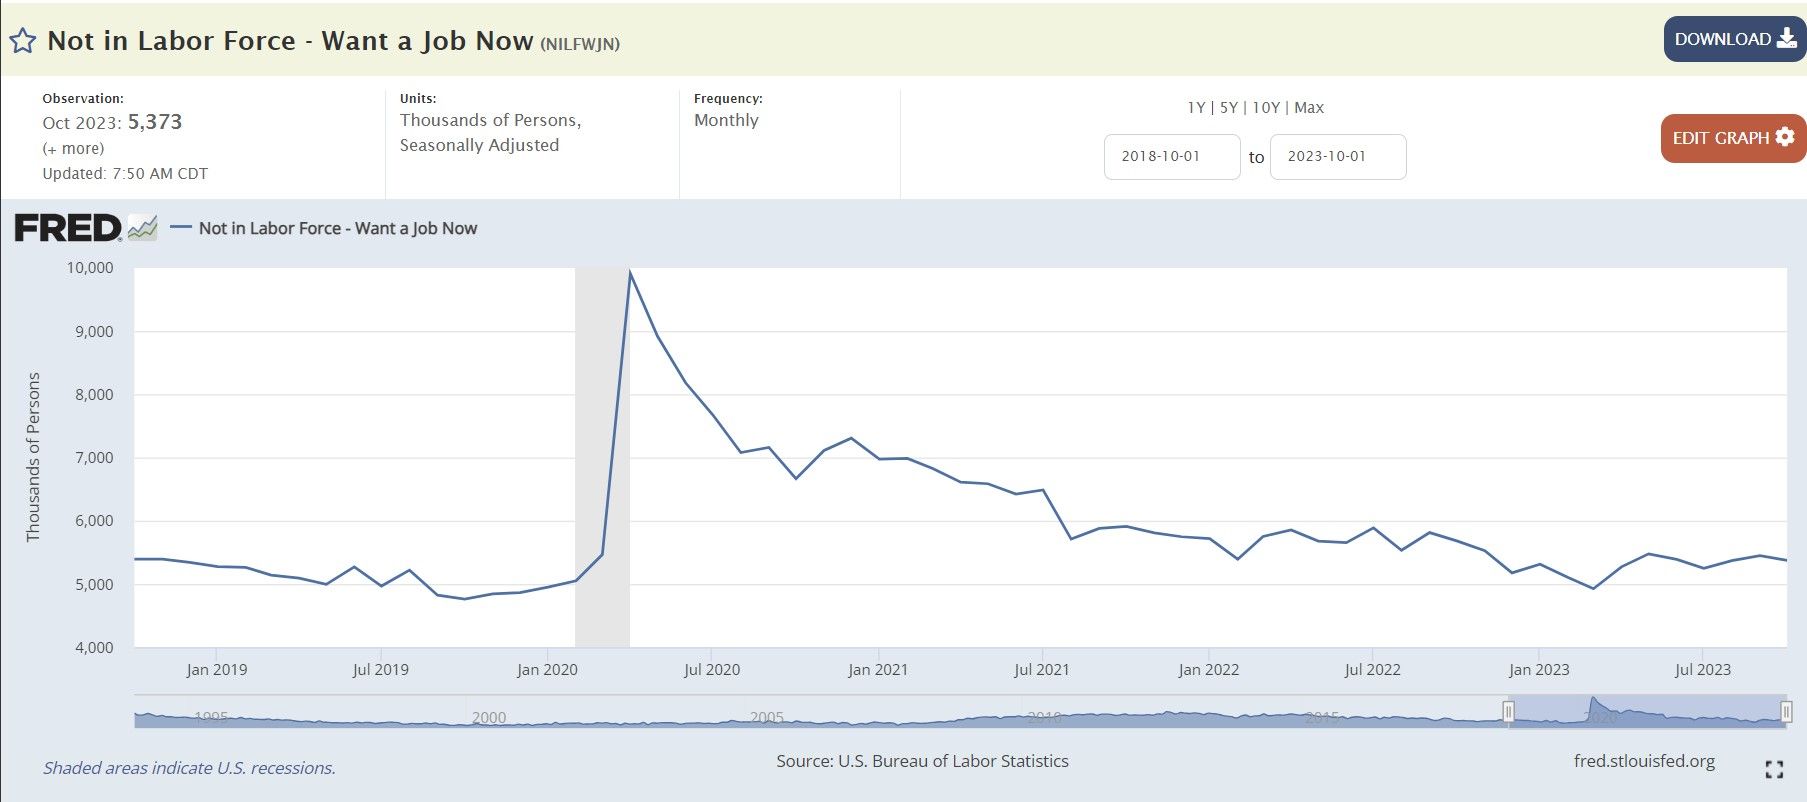
- ~5.4 million persons not in the labor force still wanted a job.
- 1.4 million persons were marginally attached to the labor force.
- 416,000 discouraged workers.
- Health care added 58,000 jobs, government employment increased by 51,000, and social assistance added 19,000 jobs in October.
- Construction employment continued to trend up with an addition of 23,000 jobs.
- Manufacturing employment decreased by 35,000 due to strike activity.
- Leisure and hospitality employment changed little with an addition of 19,000 jobs.
- Employment in professional and business services showed little change.
- Transportation and warehousing employment was little changed.
- Information employment changed little, with motion picture and sound recording trending down.
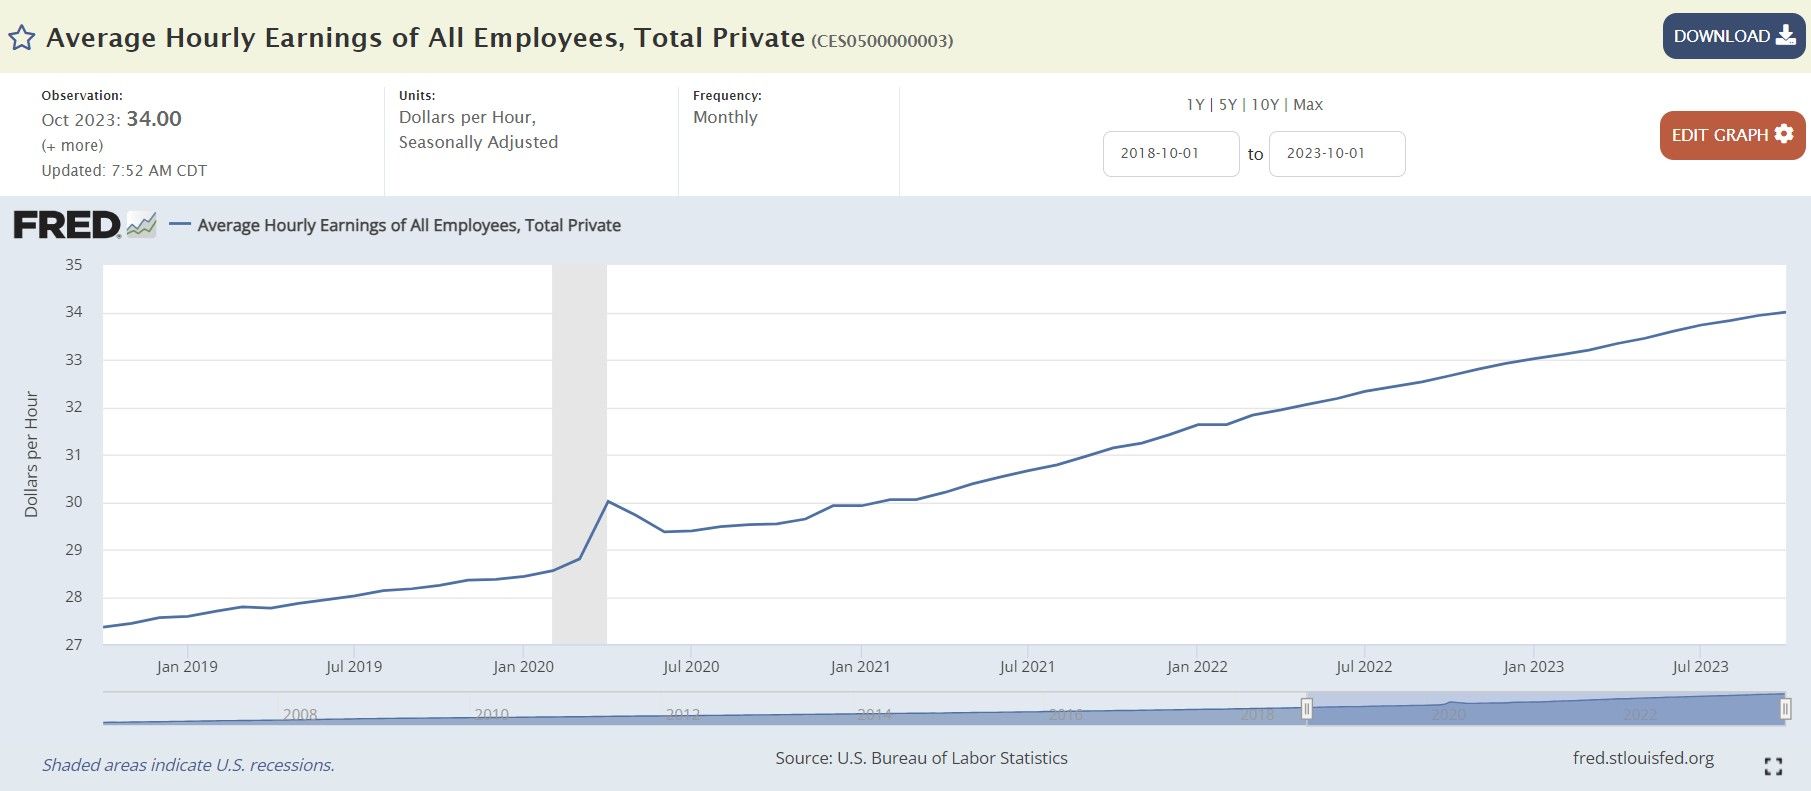
- Average hourly earnings for all employees rose by 7 cents to $34.00.
- The average workweek for all employees edged down by 0.1 hour to 34.3 hours.

- Revisions: Employment for August was revised down by 62,000, and for September by 39,000, resulting in 101,000 fewer jobs than previously reported.

Frequently Asked Questions about Employment and Unemployment Estimates:
1. Why are there two monthly measures of employment?
The household survey and establishment survey both produce sample-based estimates of employment, and both have strengths and limitations. The establishment survey employment series has a smaller margin of error on the measurement of month-to-month change than the household survey because of its much larger sample size. An over-the-month employment change of about 130,000 is statistically significant in the establishment survey, while the threshold for a statistically significant change in the household survey is about 600,000. However, the household survey has a more expansive scope than the establishment survey because it includes self-employed workers whose businesses are unincorporated, unpaid family workers, agricultural workers, and private household workers, who are excluded by the establishment survey. The household survey also provides estimates of employment for demographic groups. For more information on the differences between the two surveys, please visit www.bls.gov/web/empsit/ces_cps_trends.htm.
2. Are undocumented immigrants counted in the surveys?
It is likely that both surveys include at least some undocumented immigrants. However, neither the establishment nor the household survey is designed to identify the legal status of workers. Therefore, it is not possible to determine how many are counted in either survey. The establishment survey does not collect data on the legal status of workers. The household survey does include questions which identify the foreign and native born, but it does not include questions about the legal status of the foreign born. Data on the foreign and native born are published each month in table A-7 of The Employment Situation news release.
3. Why does the establishment survey have revisions?
The establishment survey revises published estimates to improve its data series by incorporating additional information that was not available at the time of the initial publication of the estimates. The establishment survey revises its initial monthly estimates twice, in the immediately succeeding 2 months, to incorporate additional sample receipts from respondents in the survey and recalculated seasonal adjustment factors. For more information on the monthly revisions, please visit www.bls.gov/web/empsit/cestn.htm#section7. On an annual basis, the establishment survey incorporates a benchmark revision that re-anchors estimates to nearly complete employment counts available from unemployment insurance tax records. The benchmark helps to control for sampling and modeling errors in the estimates. For more information on the annual benchmark revision, please visit www.bls.gov/web/empsit/cesbmart.htm.
4. Does the establishment survey sample include small firms?
Yes; about 40 percent of the establishment survey sample is comprised of business establishments with fewer than 20 employees. The establishment survey sample is designed to maximize the reliability of the statewide total nonfarm employment estimate; firms from all states, size classes, and industries are appropriately sampled to achieve that goal.
5. Does the establishment survey account for employment from new businesses?
Yes; monthly establishment survey estimates include an adjustment to account for the net employment change generated by business births and deaths. The adjustment comes from an econometric model that forecasts the monthly net jobs impact of business births and deaths based on the actual past values of the net impact that can be observed with a lag from the Quarterly Census of Employment and Wages. The establishment survey uses modeling rather than sampling for this purpose because the survey is not immediately able to bring new businesses into the sample. There is an unavoidable lag between the birth of a new firm and its appearance on the sampling frame and availability for selection. BLS adds new businesses to the survey twice a year.
6.Is the count of unemployed persons limited to just those people receiving unemployment insurance benefits?
No; the estimate of unemployment is based on a monthly sample survey of households. All persons who are without jobs and are actively seeking and available to work are included among the unemployed. (People on temporary layoff are included even if they do not actively seek work.) There is no requirement or question relating to unemployment insurance benefits in the monthly survey.
7. Does the official unemployment rate exclude people who want a job but are not currently looking for work?
Yes; however, there are separate estimates of persons outside the labor force who want a job, including those who are not currently looking because they believe no jobs are available (discouraged workers). In addition, alternative measures of labor underutilization (some of which include discouraged workers and other groups not officially counted as unemployed) are published each month in table A-15 of The Employment Situation news release. For more information about these alternative measures, please visit www.bls.gov/cps/lfcharacteristics.htm#altmeasures.
8. How can unusually severe weather affect employment and hours estimates?
In the establishment survey, the reference period is the pay period that includes the 12th of the month. Unusually severe weather is more likely to have an impact on average weekly hours than on employment. Average weekly hours are estimated for paid time during the pay period, including pay for holidays, sick leave, or other time off. The impact of severe weather on hours estimates typically, but not always, results in a reduction in average weekly hours. For example, some employees may be off work for part of the pay period and not receive pay for the time missed, while some workers, such as those dealing with cleanup or repair, may work extra hours. Typically, it is not possible to precisely quantify the effect of extreme weather on payroll employment estimates. In order for severe weather conditions to reduce employment estimates, employees have to be off work without pay for the entire pay period. Employees who receive pay for any part of the pay period, even 1 hour, are counted in the payroll employment figures. For more information on how often employees are paid, please visit www.bls.gov/ces/publications/length-pay-period.htm. In the household survey, the reference period is generally the calendar week that includes the 12th of the month. Persons who miss the entire week's work for weather-related events are counted as employed whether or not they are paid for the time off. The household survey collects data on the number of persons who had a job but were not at work due to bad weather. It also provides a measure of the number of persons who usually work full time but had reduced hours due to bad weather. Current and historical data are available on the household survey's most requested statistics page, please visit data.bls.gov/cgi-bin/surveymost?ln.

TLDRS:
- The household survey showed little change in the unemployment rate (3.9%) and number of unemployed persons (6.506 million).
- Average hourly earnings for all employees rose by 7 cents to $34.00.
- The average workweek for all employees edged down by 0.1 hour to 34.3 hours.
- More fuel for inflation!