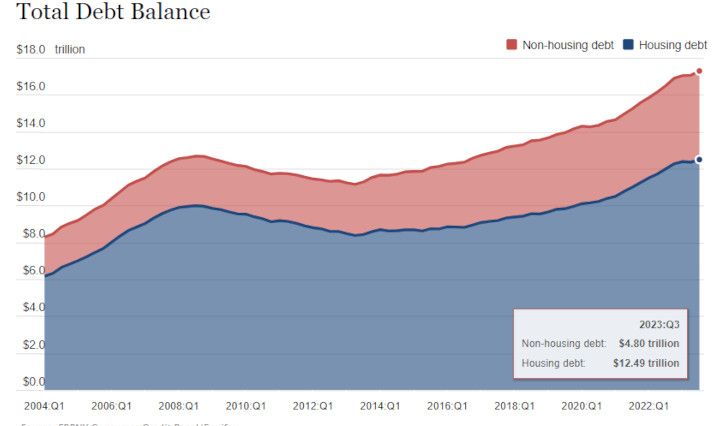
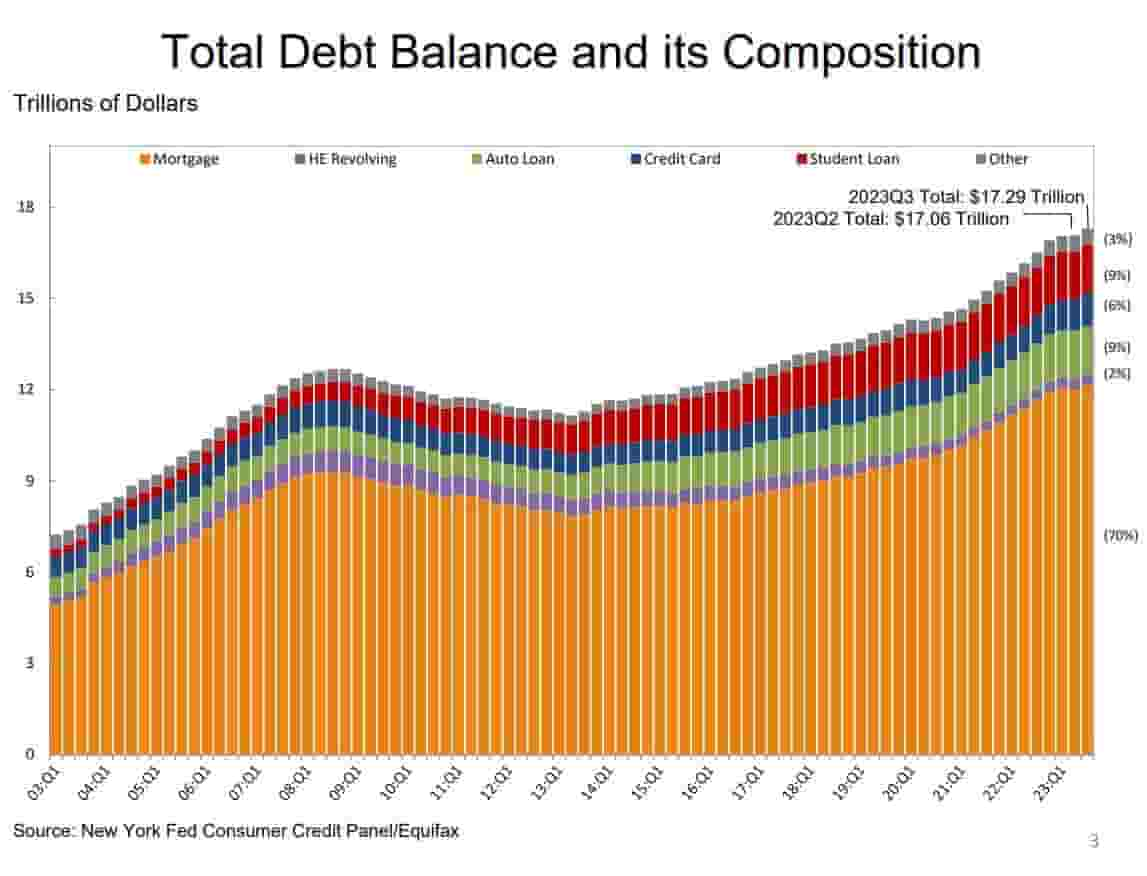
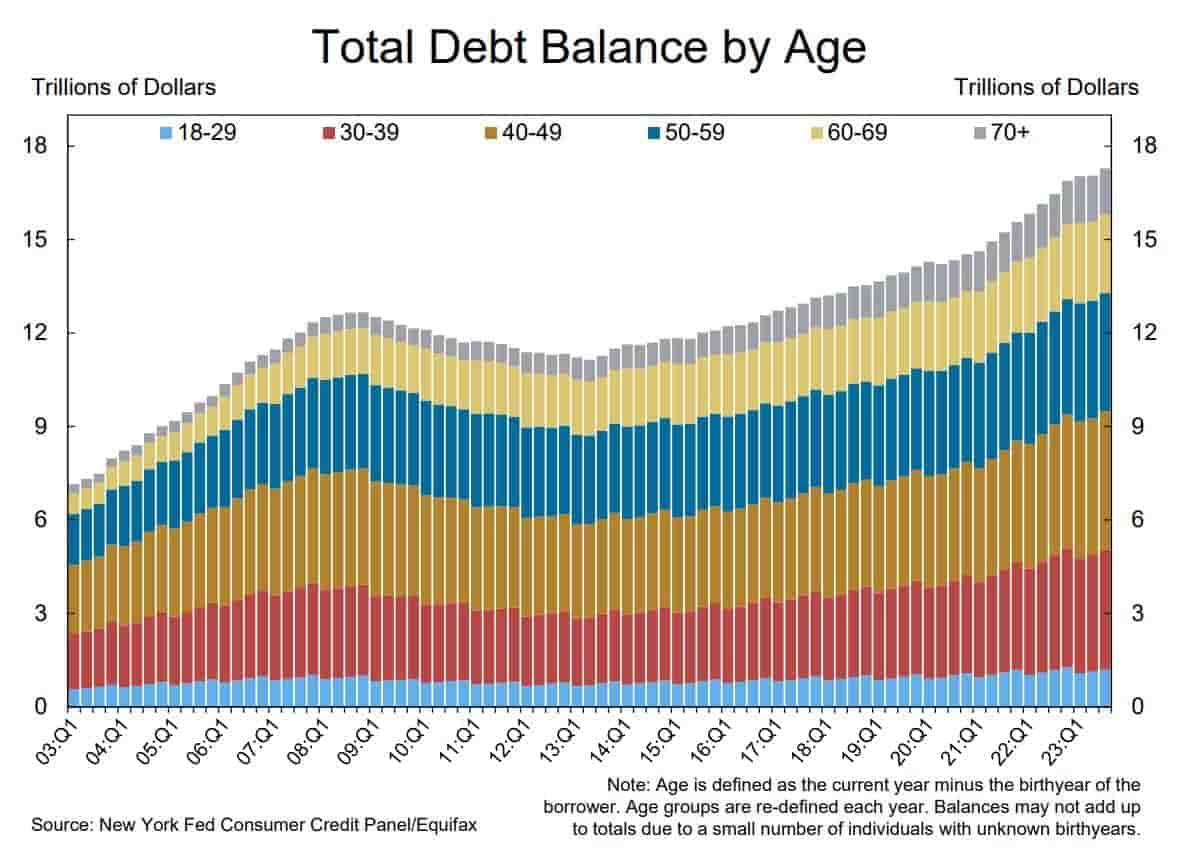
Total household debt rose by 1.3% to reach $17.29 trillion in the third quarter of 2023 led by Mortgage, Credit Card, and Student Loan Balances.
Household Debt and Credit Developments in 2023Q3:
- Aggregate household debt balances increased by $228 billion in the third quarter of 2023, a 1.3% rise from 2023Q2.
- Balances now stand at $17.29 trillion and have increased by $3.1 trillion since the end of 2019, just before the pandemic recession.
Balances:
- Mortgage balances shown on consumer credit reports increased by $126 billion during the third quarter of 2023 and stood at $12.14 trillion at the end of September.
- Balances on home equity lines of credit (HELOC) increased by $9 billion, and now stand at $349 billion in aggregate. Credit card balances, which are now at $1.08 trillion outstanding, increased by $48 billion (4.7%).
- Auto loan balances increased by $13 billion, continuing the upward trajectory that has been in place since 2011, and now stand at $1.6 trillion.
- Other balances, which include retail cards and other consumer loans, were effectively flat, with a $2 billion increase. Student loans balances grew by $30 billion and now stand at $1.6 trillion.
- In total, non-housing balances grew by $93 billion.
Originations:
- Mortgage originations, measured as appearances of new mortgages on consumer credit reports and including both refinance and purchase originations, were at $386 billion in 2023Q3, a modest decline from the previous quarter and well below the trilliondollar-plus quarterly origination volumes observed between 2020 and 2021.
- Aggregate limits on credit cards increased by $113 billion in the third quarter, or a 2.5% increase from the previous quarter and an increase of 9.5% from one year ago.
- Limits on home equity lines of credit (HELOC) were unchanged. Credit quality of newly originated loans was steady, with 4% of mortgages and 16% of auto loans originated to borrowers with credit scores under 620.
- The median credit score for newly originated mortgages was flat at 770, while the median credit score of newly originated auto loans upticked to 719 from 716.
Delinquency & Public Records:
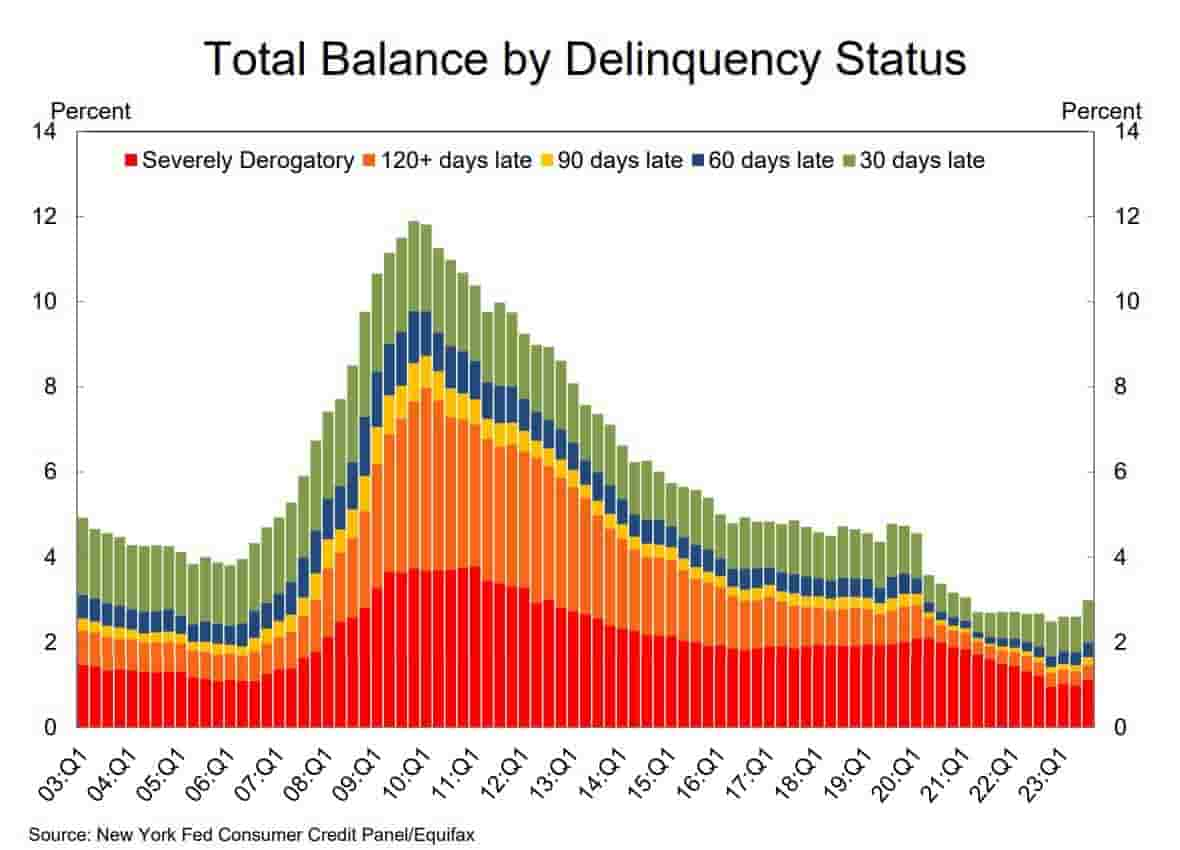
- Aggregate delinquency rates were increased in the third quarter of 2023. As of September, 3.0% of outstanding debt was in some stage of delinquency, up by 0.4 percentage points from the second quarter yet 1.7 percentage points lower than the fourth quarter of 2019.
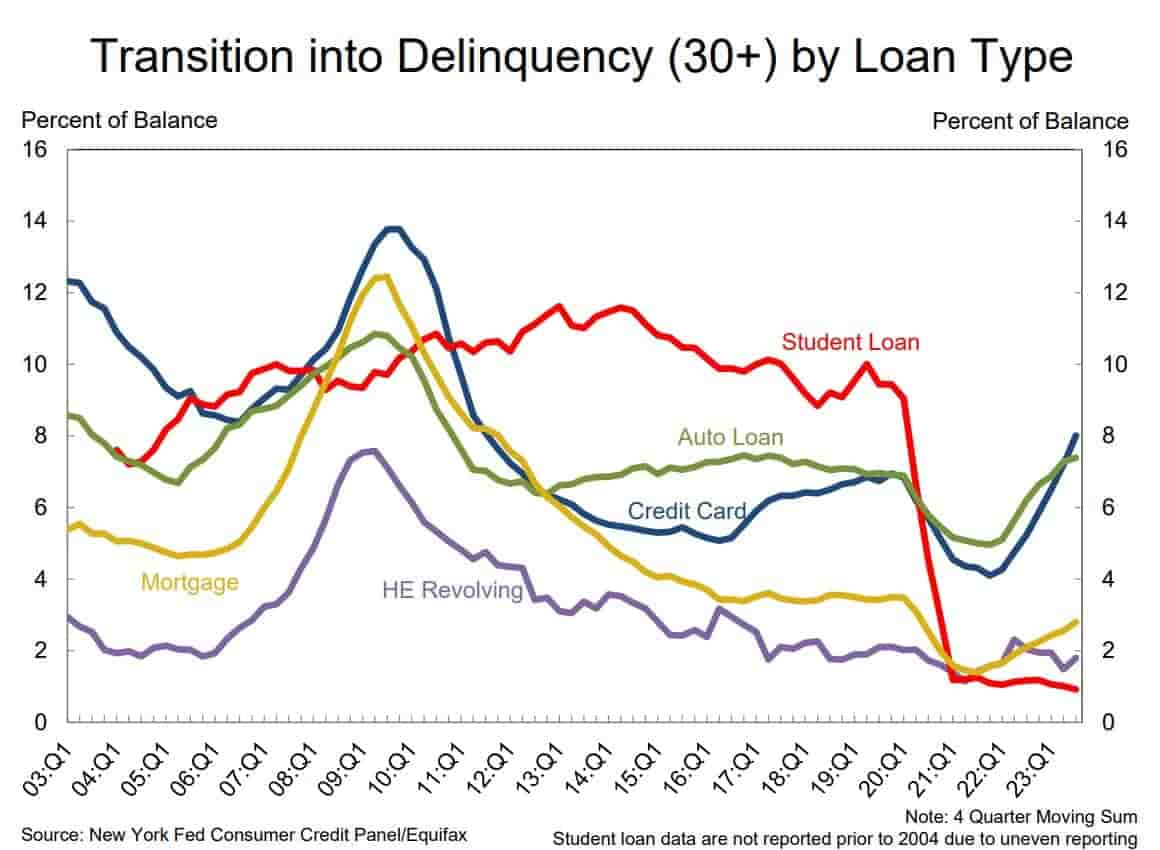
- Delinquency transition rates increased for all product types, except for student loans.
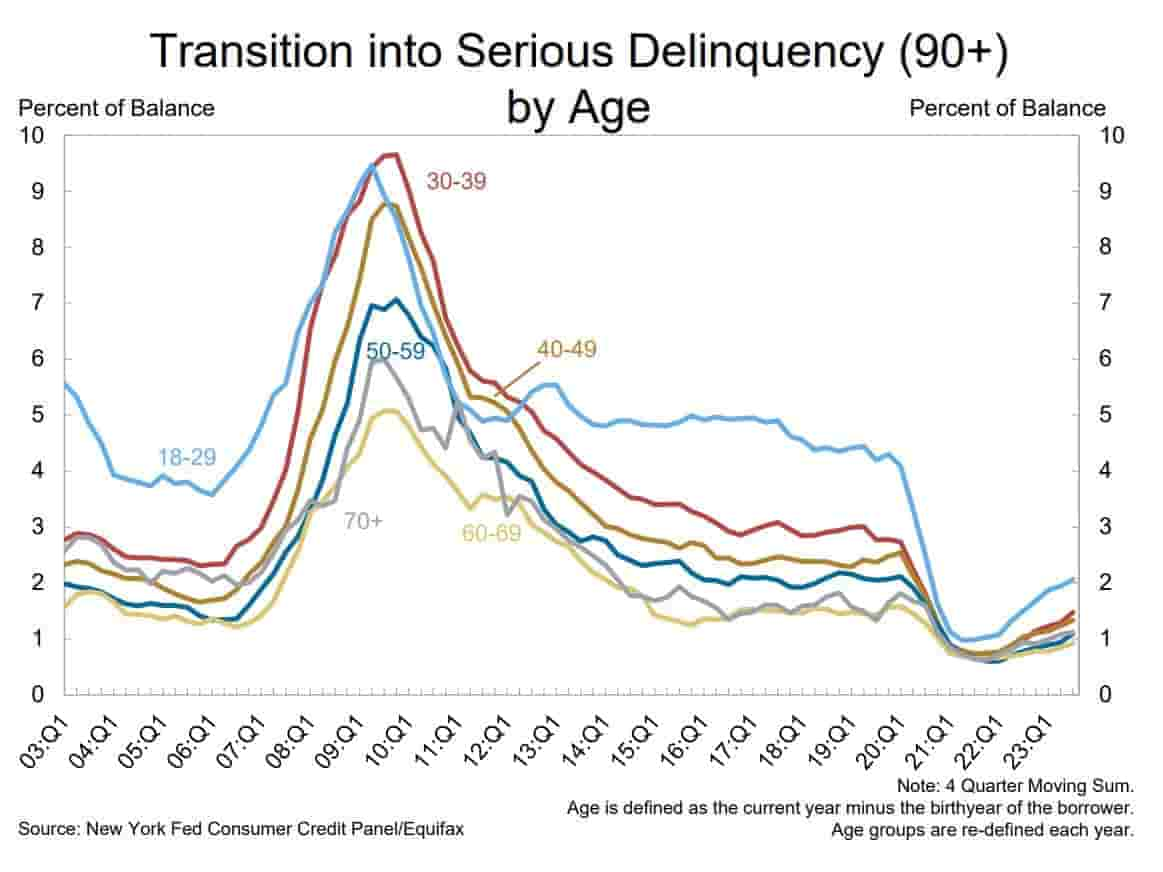
- Annualized, approximately 8% of credit card balances and 7.4% of auto loan balances transitioned into delinquency; with credit card delinquency transitions showing a 0.8 percentage point increase. Increases in credit card delinquency were the sharpest among borrowers between ages 30-39.
- Delinquency transition rates for mortgages increased by 0.2 percentage points.
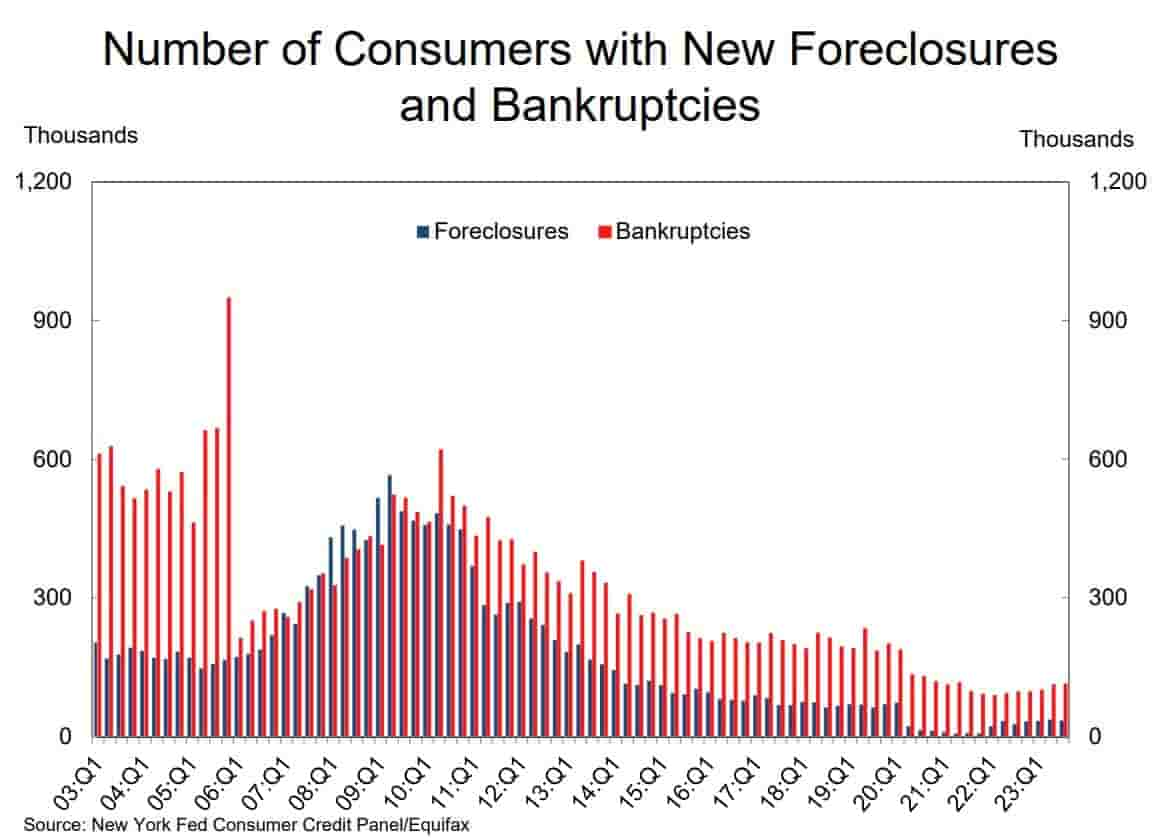
- About 116,000 consumers had a bankruptcy notation added to their credit reports in 2023Q3, slightly more than in the previous quarter.
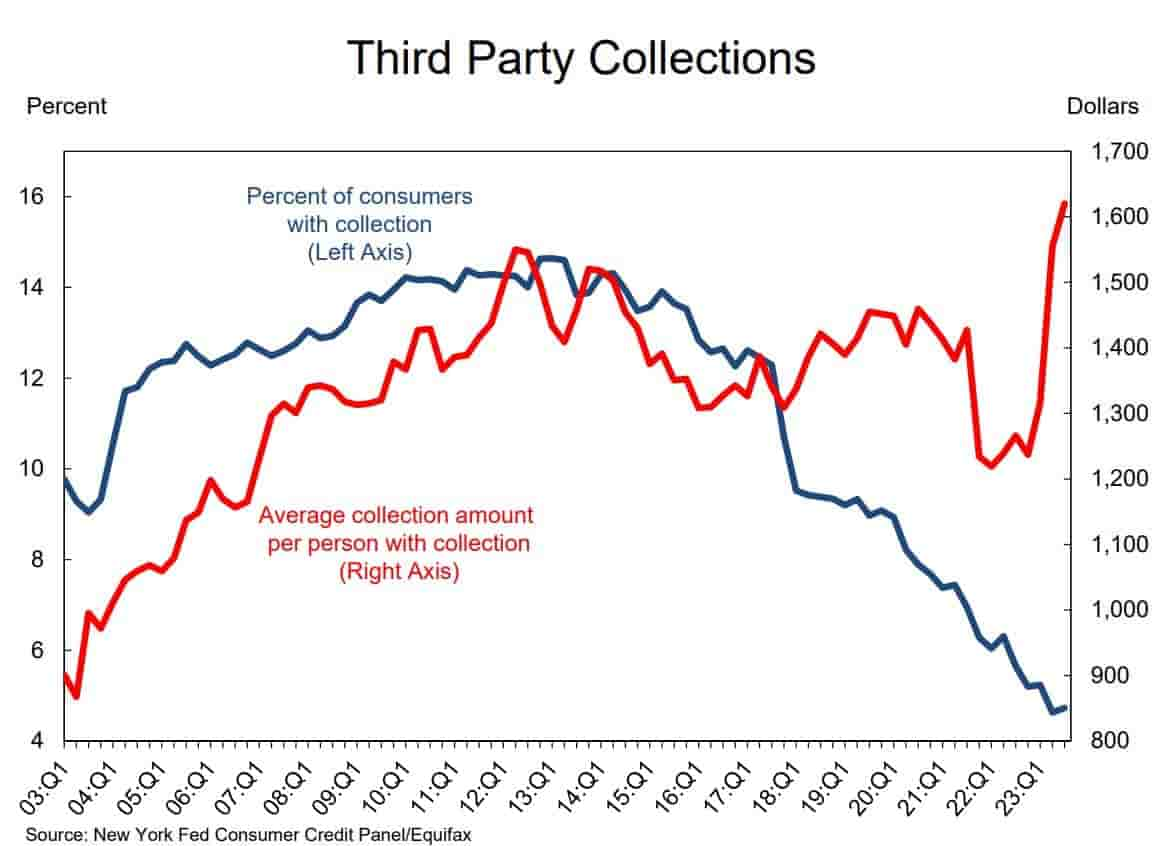
- Approximately 4.7% of consumers have a 3rd party collection account on their credit report.
Housing Debt:
- There was $386 billion in newly originated mortgage debt in 2023Q3.
- About 36,000 individuals had new foreclosure notations on their credit reports, a small decline.
- New foreclosures have stayed very low since the CARES Act moratorium was lifted.
Student Loans
- Outstanding student loan debt increased by $30 billion and stood at $1.6 trillion in 2023Q3.
- Missed federal student loan payments will not be reported to credit bureaus until 2024Q4.
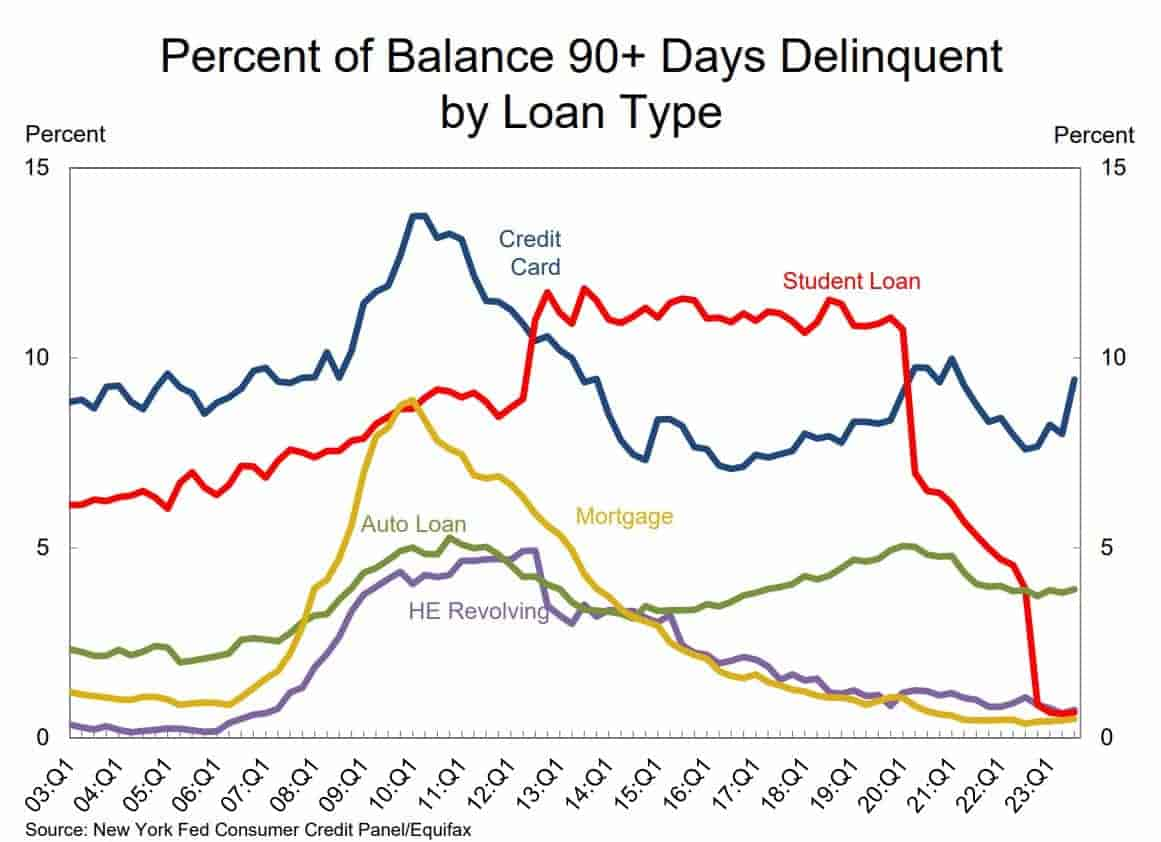
- Because of these policies, less than 1% of aggregate student debt was reported 90+ days delinquent or in default in 2023Q3 and will remain low until at least 2024Q4.

TLDRS:
- U.S. aggregate household debt increased by $228 billion to $17.29 trillion in Q3 2023, marking a 1.3% rise from Q2 and a $3.1 trillion increase since the end of 2019.
- Mortgage balances rose by $126 billion to $12.14 trillion, while HELOC balances went up by $9 billion to $349 billion, and credit card debt jumped by $48 billion to $1.08 trillion.
- Auto loan balances continued an upward trend with a $13 billion increase to $1.6 trillion, and student loan balances also grew by $30 billion, reaching $1.6 trillion.
- Mortgage originations declined to $386 billion, a modest drop from Q2 and significantly lower than the volumes between 2020 and 2021; credit card limits rose by $113 billion, a 2.5% increase from Q2.
- Delinquency rates increased to 3.0% of outstanding debt, with notable rises in credit card and auto loan delinquencies, particularly among borrowers aged 30-39.
- Mortgage delinquency transitions increased slightly, and new foreclosure notations on credit reports slightly declined, remaining low post-CARES Act moratorium.
- Student loan debt rose to $1.6 trillion, with missed payments not being reported to credit bureaus until Q4 2024, keeping delinquency rates reported artificially below 1% until then.