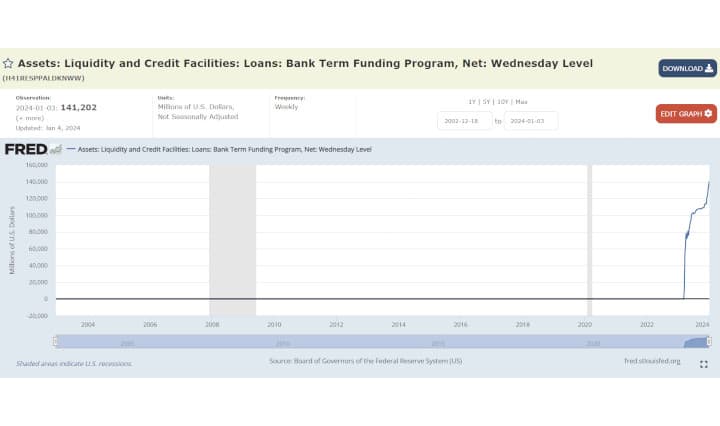
Some fun with the charts in the U.S. MMFs’ repos with the Federal Reserve, and data showing treasuries could be used as collateral.
I started by looking here.

It is delayed data but is better than nothing!
I think it is safe to say the increased Failure's to Deliver in Treasuries is part of what is at least driving demand in the Reverse Repo market:

https://www.financialresearch.gov/short-term-funding-monitor/market-digests/collateral/chart-3/
6/2:
US Treasuries: $112,795,000,000
Federal Agency and GSE Securities: $13,658,000,000
Corporate Securities: $30,502,000,000
Other MBS: $2,684,000,000
As suspected, the failure to receives on treasuries is also blowing up:

https://www.financialresearch.gov/short-term-funding-monitor/market-digests/collateral/chart-4/
6/2:
US Treasuries: $117,361,000,000
Federal Agency and GSE Securities: $7,139,000,000
Corporate Securities: $20,962,000,000
Other MBS: $1,386,000,000
Now look at the explosion of treasuries as collateral at the end here:

https://www.financialresearch.gov/short-term-funding-monitor/market-digests/collateral/chart-6/
6/3:
US Treasuries: $1,066,538,939,091
Federal Agency and GSE Securities: $406,492,772,495
Corporate Debt: $68,145,033,179
Other Collateral: $195,562,855,657
Where are they coming from besides the RRP? I do think this chart shows the increased RRP usage is going towards collateral requirements.