September Survey of Consumer Expectations: Inflation expectations 1yr 3.7%, 3yr 3.0% >2%. Households’ perceptions & expectations for credit conditions deteriorated.

Source
September 2023 Survey of Consumer Expectations.
The main findings from the September 2023 Survey are:
Inflation
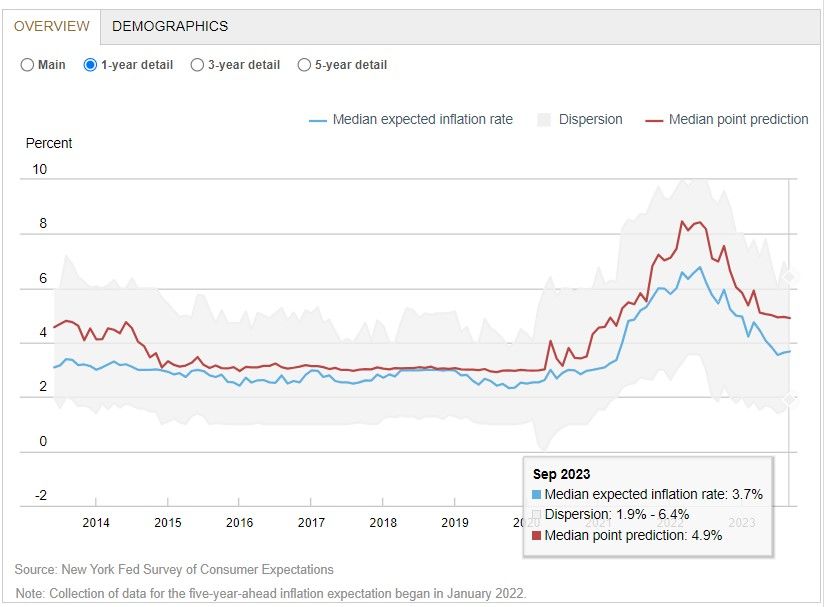
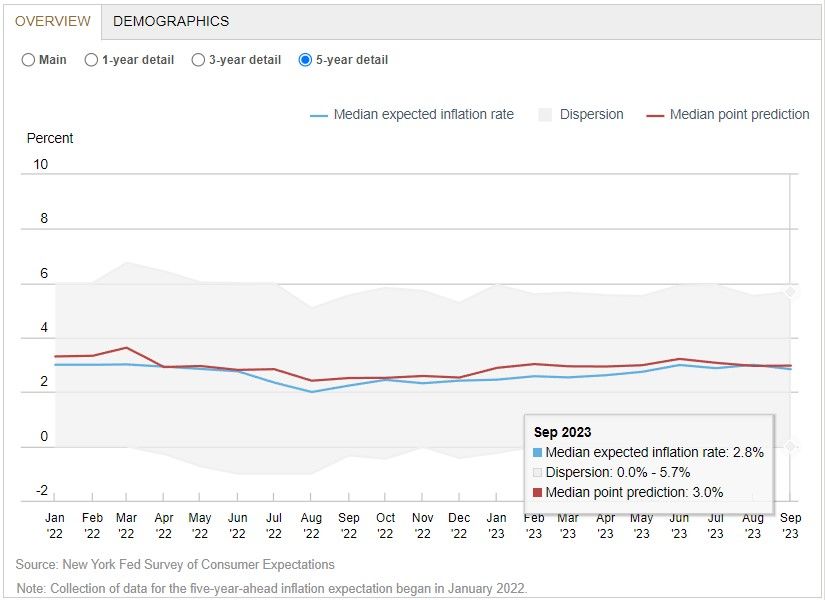
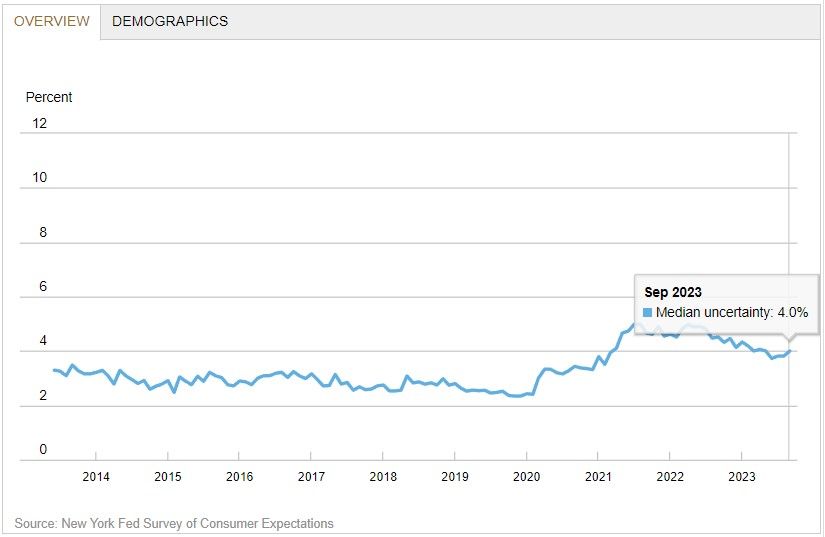
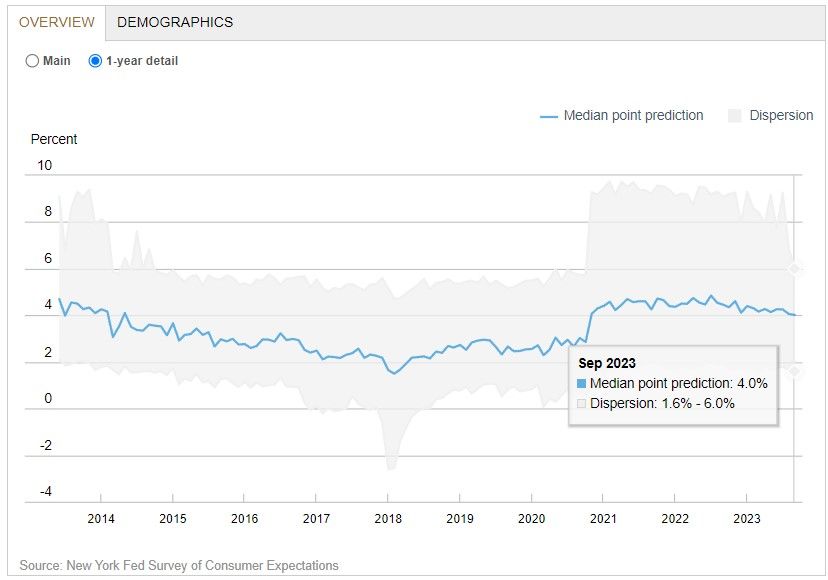
- Median inflation expectations increased by 0.1 and 0.2 percentage points at the one- and three-year-ahead horizons to 3.7% and 3.0%, respectively. In contrast, median inflation expectations decreased by 0.2 percentage point to 2.8% at the five-year-ahead horizon.
- The survey’s measure of disagreement across respondents (the difference between the 75th and 25th percentile of inflation expectations) decreased at the one-year-ahead horizon, but increased at the three- and five-year-ahead horizons.
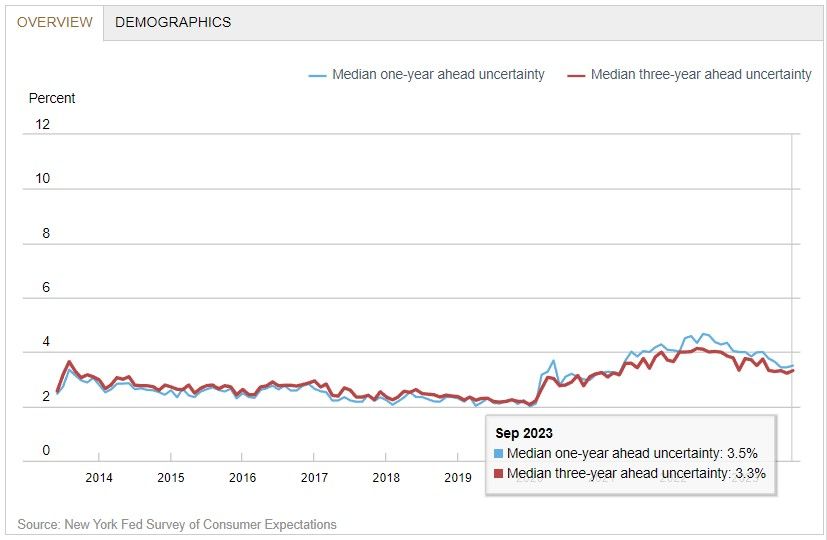
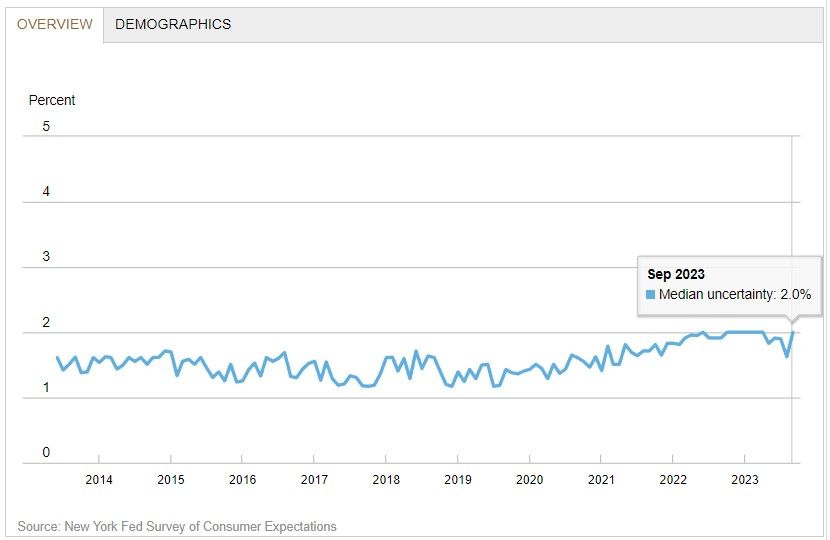
- Median inflation uncertainty—or the uncertainty expressed regarding future inflation outcomes—increased slightly across all three horizons.


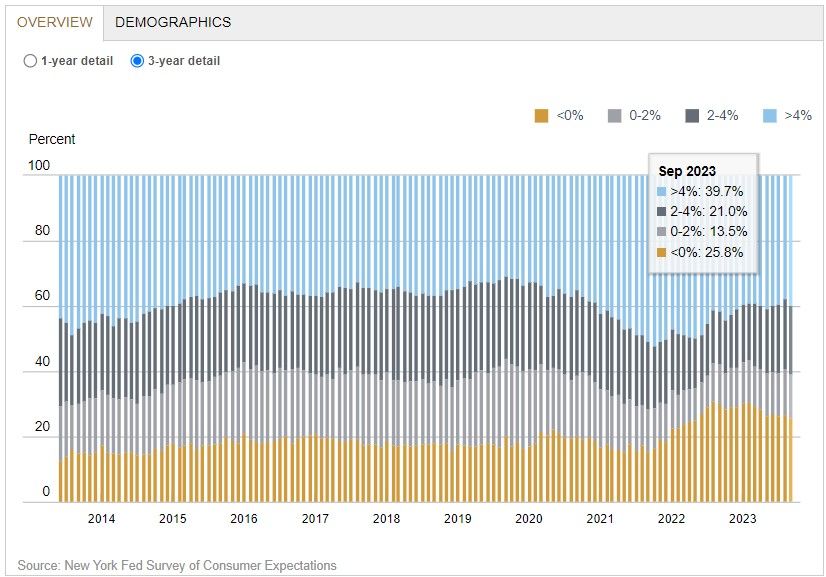
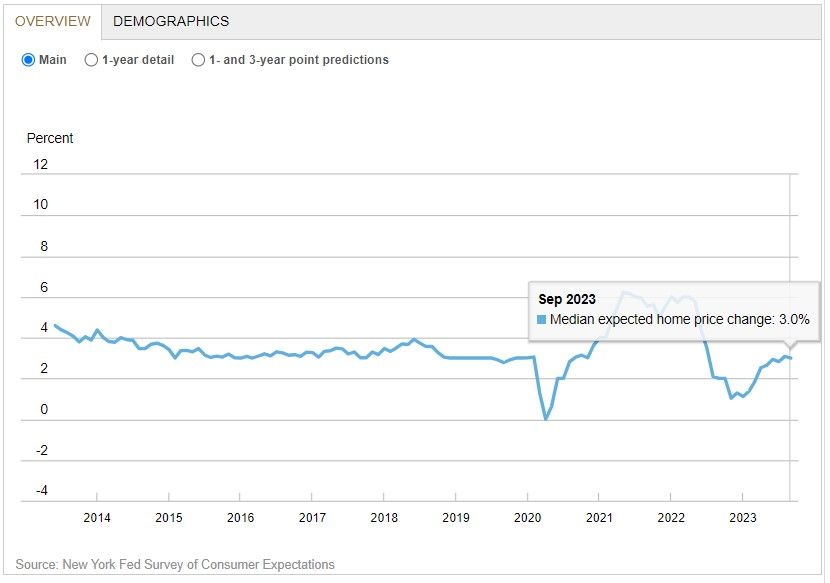
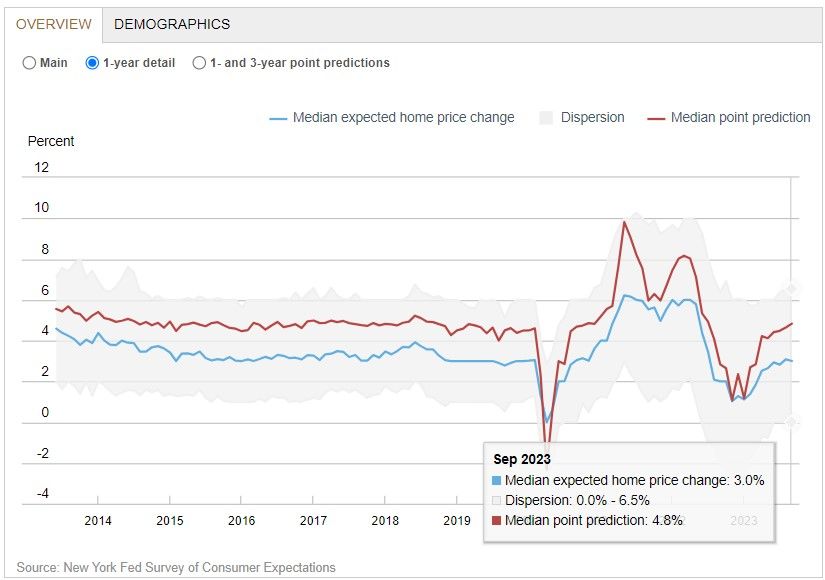
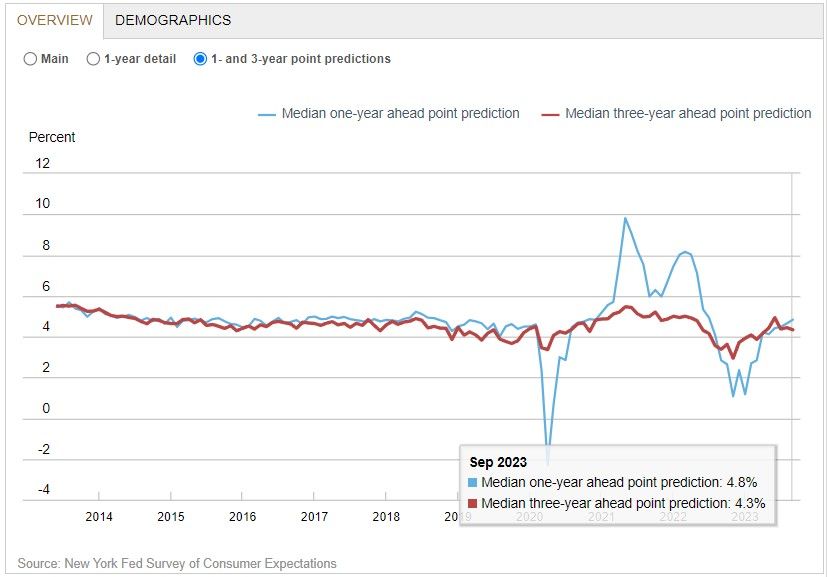
Home Price Change Expectations
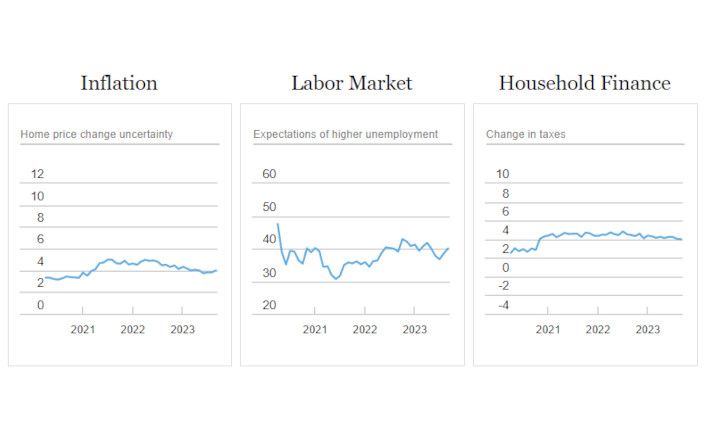
- Median home price growth expectations decreased to 3.0% in September from 3.1% in August. The decrease was more pronounced among respondents below the age of 40 and those who live in the South Census regions.
Commodity Price Change Expectations
- The median one-year ahead expected change in the cost of college education decreased sharply to 5.8% from 8.2%, its largest one-month decrease since the onset of the survey in 2013. Median year-ahead expected price changes declined by 0.1, 0.4 and 0.1 percentage point for the cost of gas (to 4.8%), medical care (to 8.8%) and rent (to 9.1%), respectively. In contrast, median year-ahead expected price changes for food increased by 0.3 percentage point (to 5.6%).

Labor Market
Earnings Growth Expectations
- Median one-year-ahead expected earnings growth increased by 0.1 percentage to 3.0% in September. The series has been moving within a narrow range of 2.8% to 3.0% since September 2021. The increase was most pronounced among respondents with some college education.


Expectations of Higher Unemployment
- Mean unemployment expectations—or the mean probability that the U.S. unemployment rate will be higher one year from now—increased by 1.6 percentage points to 40.1%, equal to its 12-month trailing average.

Job Separation Expectations
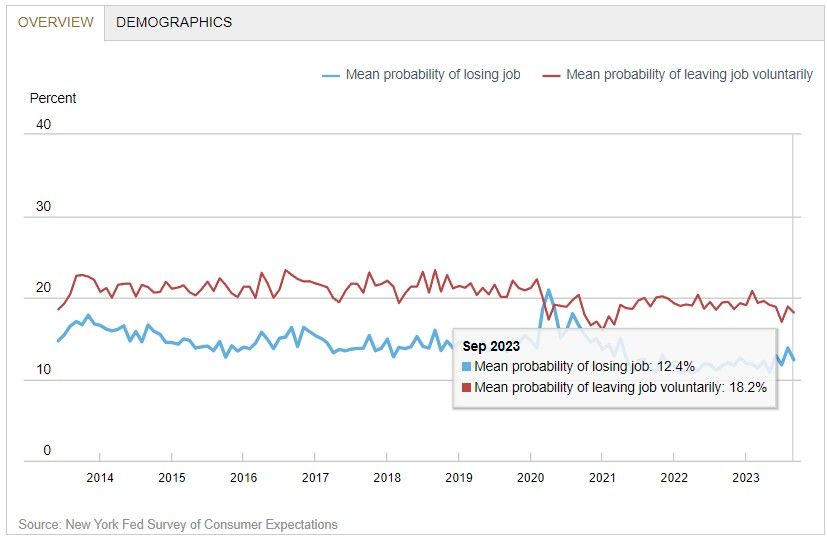
- The mean perceived probability of losing one’s job in the next 12 months decreased by 1.4 percentage points to 12.4%, remaining slightly above its 12-month trailing average of 12.1%. The mean probability of leaving one’s job voluntarily in the next 12 months decreased as well, by 0.7 percentage point, to 18.2%.
Job Finding Expectations
- The mean perceived probability of finding a job (if one’s current job was lost) increased to 56.5% from 55.7%, just below its 12-month trailing average of 56.9%. The increase was driven by respondents above the age of 60.


Household Finance
Household Income Growth Expectations
- Median expected growth in household income increased by 0.1 percentage point to 3.0%, remaining below the series 12-month trailing average of 3.5%.


Household Sending Growth Expectations
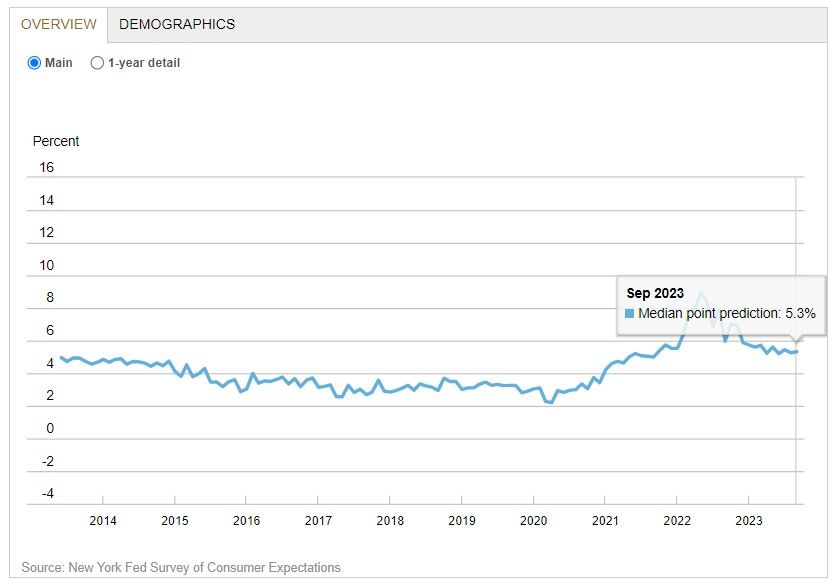
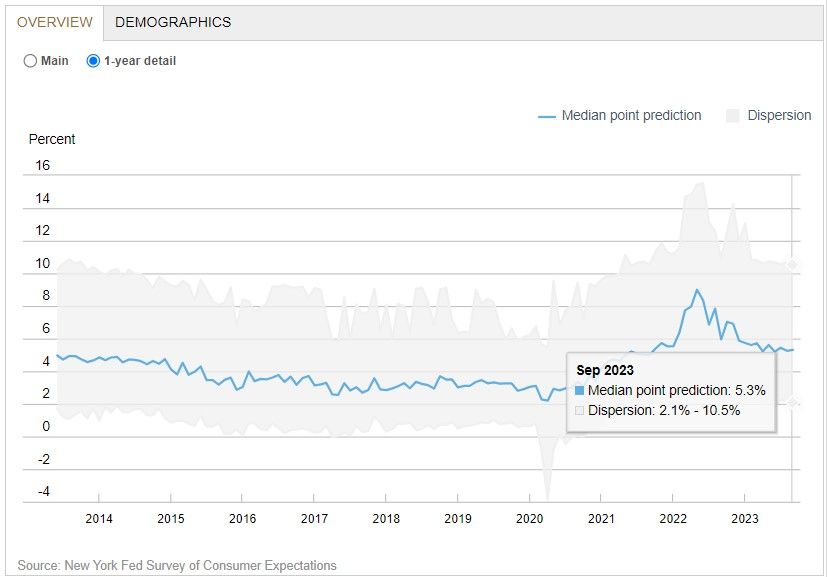
- Median household spending growth expectations remained unchanged at 5.3% in September, remaining well above pre-pandemic levels.
Change in Credit Availability
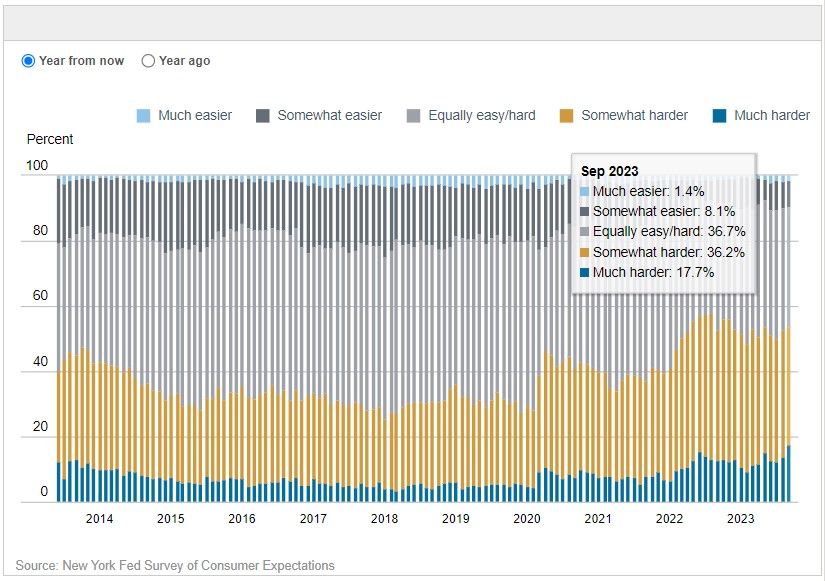
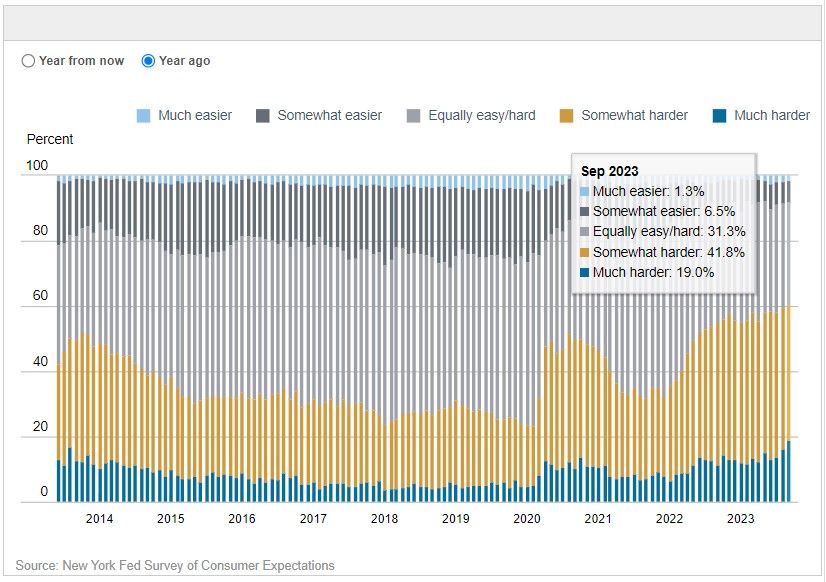
- Perceptions of credit access compared to a year ago deteriorated slightly. The share of households reporting that it is more difficult to obtain credit now than a year ago increased, while the share reporting that it is easier declined. Similarly, respondents’ views about future credit availability deteriorated slightly. The share of respondents expecting tighter credit conditions a year from now increased, while the share expecting looser credit conditions declined.
Debt Delinquency Expectations
- The average perceived probability of missing a minimum debt payment over the next three months increased by 1.4 percentage points to 12.5%, the highest reading since May 2020. The increase was largest for respondents below the age of 40, with some college education, and those with an annual household income below $50k.

Change in Taxes
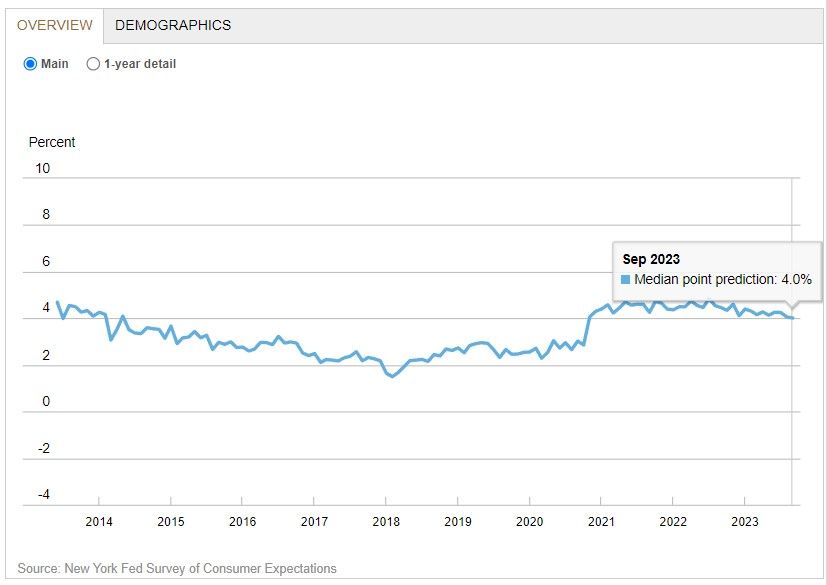
- The median expectation regarding a year-ahead change in taxes (at current income level) decreased to 4.0% from 4.1%, its lowest reading since October 2020.
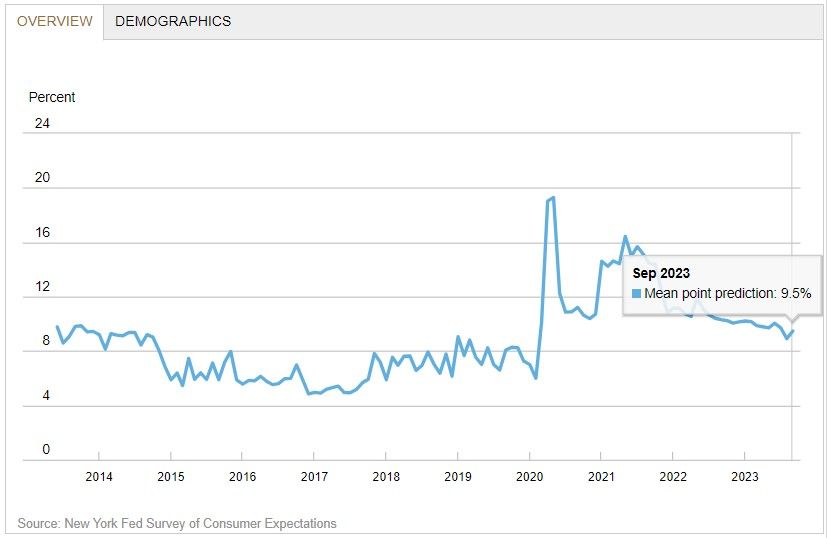
Government debt growth expectations
- Median year-ahead expected growth in government debt increased by 0.6 percentage point to 9.5%, remaining below the series 12-month trailing average of 9.9%.
Expectations of Higher Interest Rate on Savings Accounts
- The mean perceived probability that the average interest rate on saving accounts will be higher in 12 months increased by 0.7 percentage point to 30.8%.

Household Financial Situation
- Perceptions about households’ current financial situations deteriorated slightly in September with more respondents reporting being worse off than a year ago and fewer respondents reporting being better off. In contrast, year-ahead expectations improved with more respondents expecting to be better off a year from now.


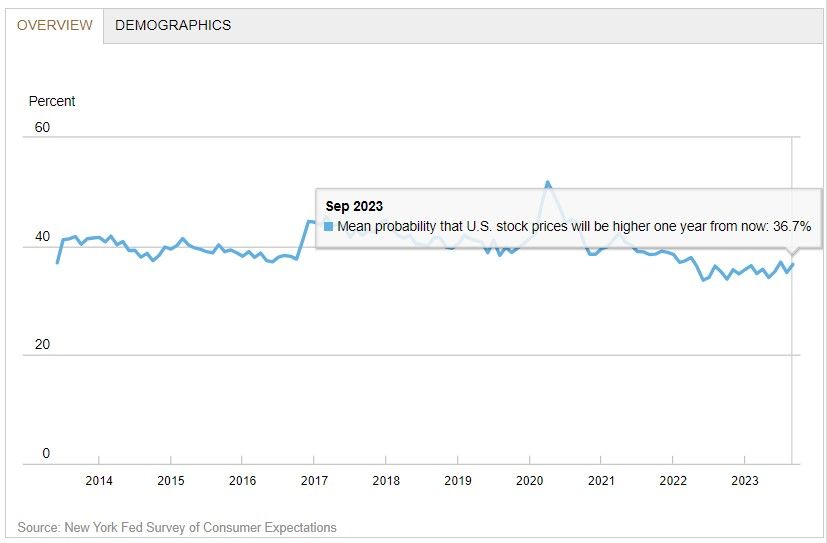
Expectations of Higher Stock Prices
- The mean perceived probability that U.S. stock prices will be higher 12 months from now increased by 1.5 percentage point to 36.7%.
About the Survey of Consumer Expectations (SCE)
The SCE contains information about how consumers expect overall inflation and prices for food, gas, housing, and education to behave. It also provides insight into Americans’ views about job prospects and earnings growth and their expectations about future spending and access to credit. The SCE also provides measures of uncertainty regarding consumers’ outlooks. Expectations are also available by age, geography, income, education, and numeracy.
The SCE is a nationally representative, internet-based survey of a rotating panel of approximately 1,300 household heads. Respondents participate in the panel for up to 12 months, with a roughly equal number rotating in and out of the panel each month. Unlike comparable surveys based on repeated cross-sections with a different set of respondents in each wave, this panel allows us to observe the changes in expectations and behavior of the same individuals over time. For further information on the SCE, please refer to an overview of the survey methodology here, the interactive chart guide, and the survey questionnaire.

TLDRS:
- The Federal Reserve Bank of New York’s Center for Microeconomic Data today released the September 2023 Survey of Consumer Expectations.
- Inflation expectations increased in the short- and medium-term horizons, while they decreased at the longer-term horizon.
- Households' inflation expectations sure seem entrenched ABOVE the Fed's 2% goal!
- Labor market expectations were mixed with unemployment expectations deteriorating and perceived job loss risk improving.
- Households’ perceptions and expectations for credit conditions deteriorated slightly.
- The average perceived probability of missing a minimum debt payment over the next three months increased by 1.4 percentage points to 12.5%, the highest reading since May 2020.
- Reminder, while banks have the liquidity fairy, 'we' get the promise of 2 more rate hikes this year, Atlanta Fed President Raphael Bostic yet again enrichens himself inappropriately from his position.
- To fix one end of their mandate (price stability) from the inflation problem they created, the Fed will continue sacrificing employment (the other end of their mandate) to bolster price stability by continuing to raise interest rates--causing further stress to businesses and households.
- I believe inflation is the match that has been lit that will light the fuse of our rocket.

