Inflation Alert! Producer Price Index Rises 0.5% in September, 2.2% for year. This is the largest increase since April. Inflation still raging.

Good morning and Happy Wednesday! Today before the CPI numbers, the Bureau of Labor Statistics released the Producer Price Index for final demand for September:
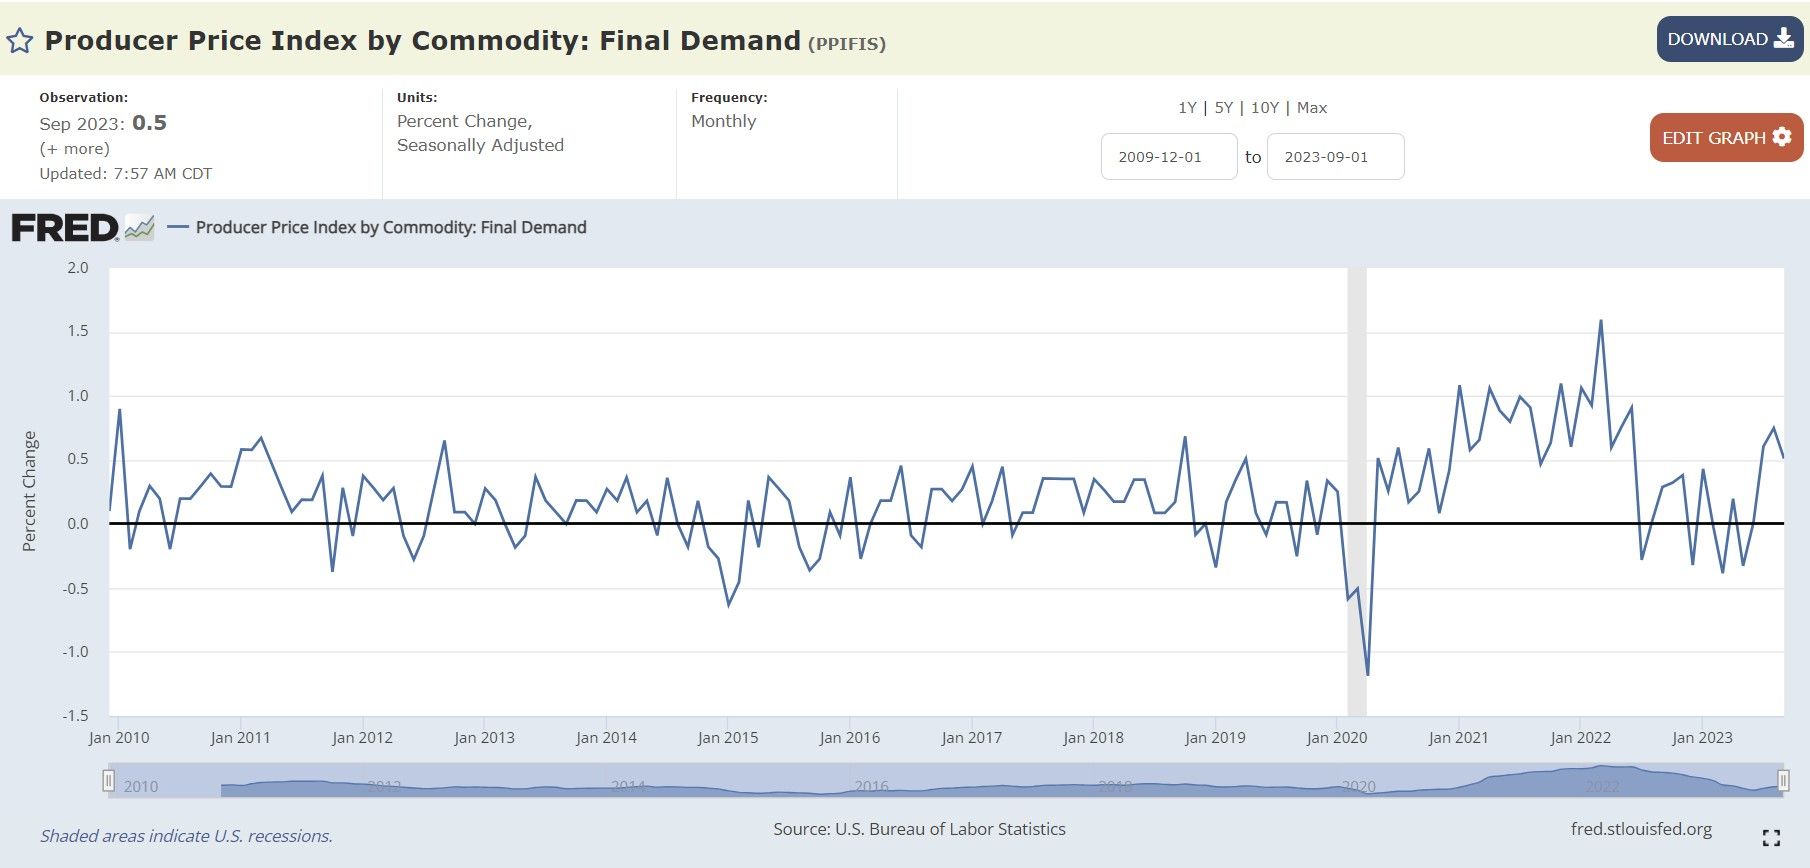
The Producer Price Index for Final Demand tracks the input prices for consumer-facing industries whose output prices are then tracked by the Consumer Price Index--think of this like the pipeline for inflation.
When it costs firms more to produce their goods, those costs are generally passed down to consumers, leading to higher CPI.
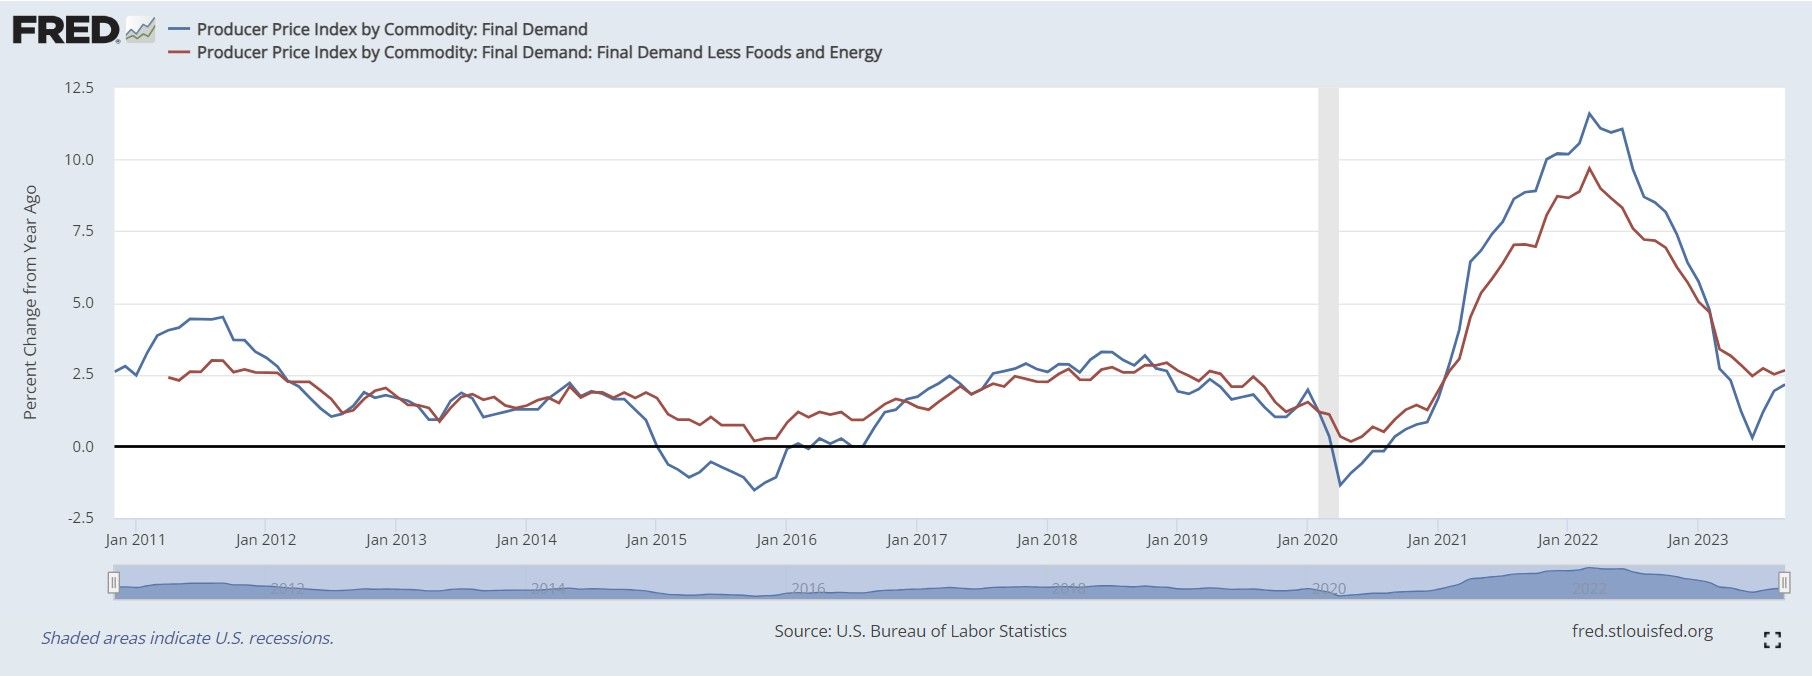
Falling January to June, this has begun to 'rebound' in a big way and is above the Fed's 2% target:
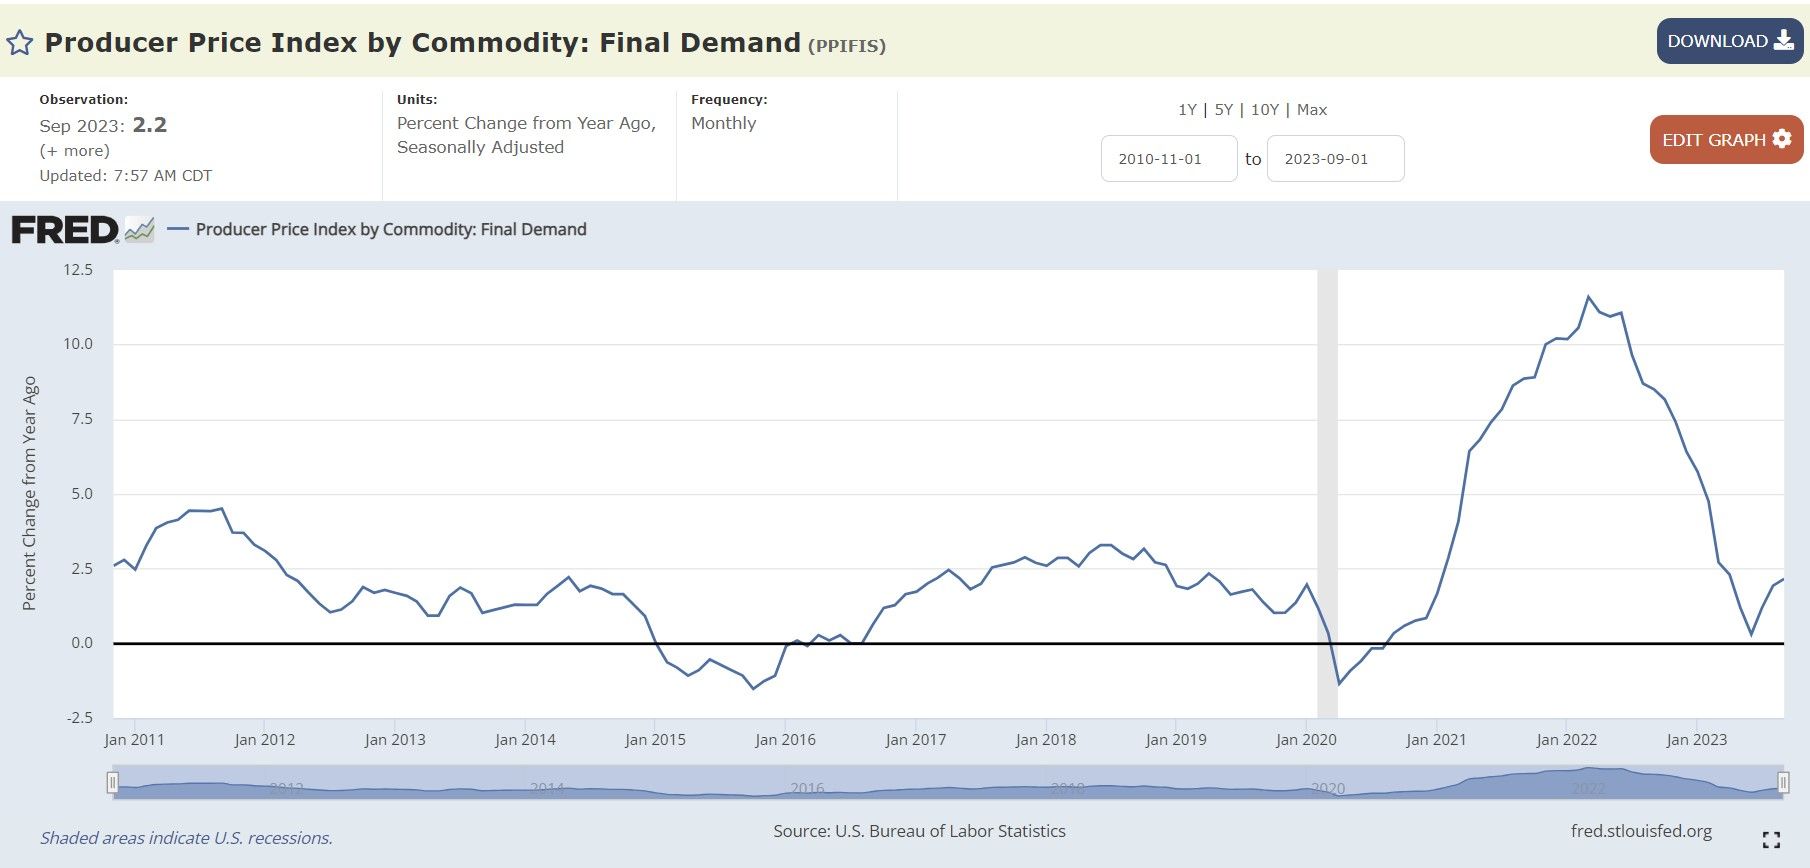
Again, this marks the 4th straight month of growth in a row after it was 'tamed' earlier in the year. This does not fully include the jump in fuel prices following OPEC's production cuts--that pain is still unfurling and making its way to folks in the form of higher prices at the pump.
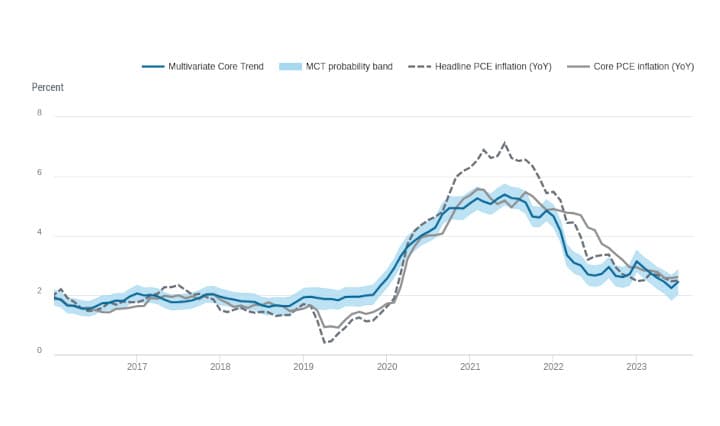
Without food and energy, the 'core' producer prices rose .28819% for the month and by 2.65% from a year ago--inflation is still entrenched well above the Fed's 2% target:
Again, do you really think firms are going to just 'eat' this increased production cost or that they will continue to pass to consumers?
Wut Mean?
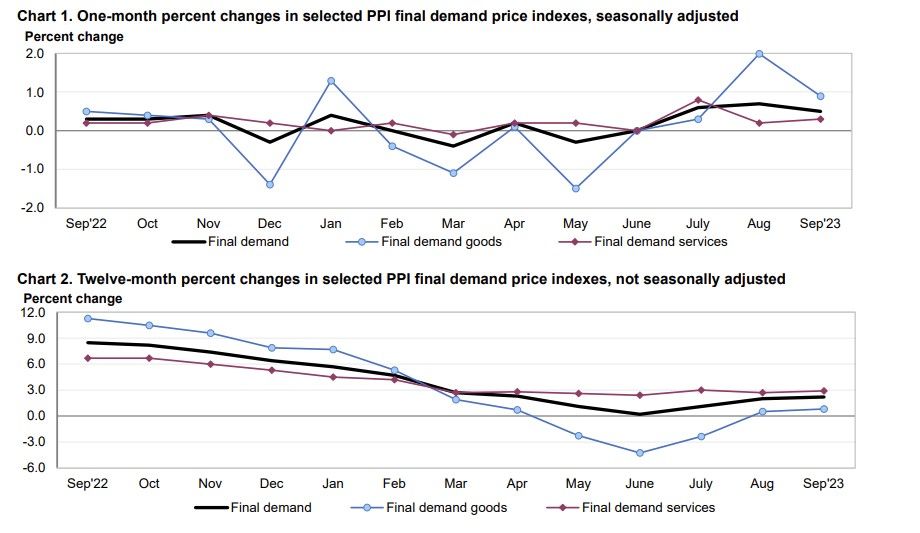
- The Producer Price Index for final demand increased 0.5 percent in September, seasonally adjusted, the U.S. Bureau of Labor Statistics reported today.
- Final demand prices rose 0.7 percent in August and 0.6 percent in July.
- On an unadjusted basis, the index for final demand advanced 2.2 percent for the 12 months ended in September, the largest increase since moving up 2.3 percent for the 12 months ended in April.
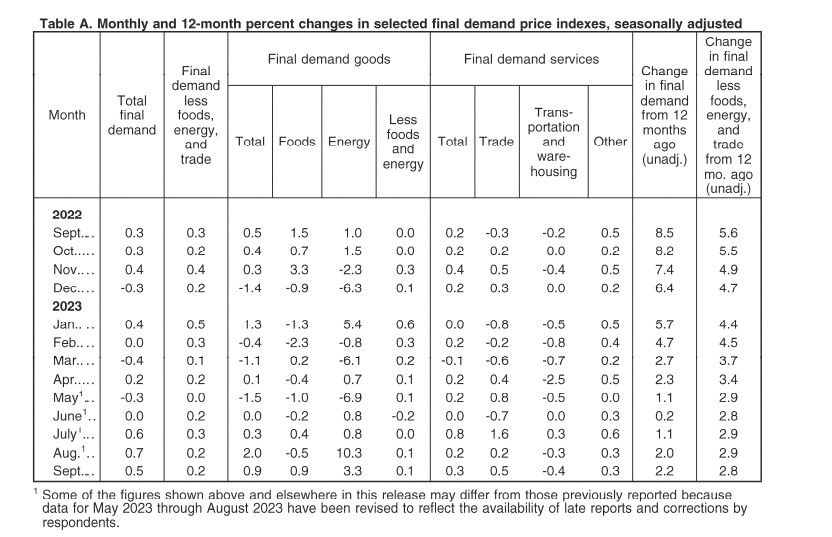
- Leading the increase in the final demand index in September, prices for final demand goods rose 0.9 percent.
- The index for final demand services advanced 0.3 percent.
- Prices for final demand less foods, energy, and trade services increased 0.2 percent in September, the fourth consecutive advance.
- For the 12 months ended in September, the index for final demand less foods, energy, and trade services moved up 2.8 percent.
Brief Explanation of Producer Price Indexes
The Producer Price Index (PPI) of the Bureau of Labor Statistics (BLS) is a family of indexes that measures the average change over time in prices received (price changes) by producers for domestically produced goods, services, and construction. PPIs measure price change from the perspective of the seller. This contrasts with other measures, such as the Consumer Price Index (CPI). CPIs measure price change from the purchaser’s perspective.
More than 10,000 PPIs for individual products and groups of products are released each month. PPIs are available for the products of virtually every industry in the mining and manufacturing sectors. Over time, new PPIs have been introduced for products of industries in the services and construction sectors of the U.S. economy. As of January 2023, the PPI covered 69 percent of services as measured by 2017 Census revenue, and 17 percent of construction.
More than 64,000 price quotations per month are organized into three sets of PPIs: (1) Final demand Intermediate demand (FD-ID) indexes, (2) commodity indexes, and (3) indexes for the net output of industries and their products. The FD-ID structure organizes products by class of buyer and degree of fabrication as well as by stage of production. The commodity structure organizes products by similarity of end use or product type. The entire output of various industries is sampled to derive price indexes for the net output of industries and their products.
Other Definitions to know:
Final Demand–Intermediate Demand Indexes
The PPI FD-ID structure measures price change for goods, services, and construction sold to final demand and to intermediate demand. The FD-ID system replaced the PPI stage-of-processing (SOP) system as PPI’s primary aggregation model with the release of data for January 2014. The FD-ID model expands coverage beyond that of the SOP system through the addition of services, construction, exports, and government purchases.
Compared with finished goods under the SOP system, the PPI for final demand goods includes nearly a 50 percent expansion of coverage. This increase can be traced to the addition of government purchases and exports. For overall final demand, expansion to include final demand services represents an even larger increase in coverage. In December 2022, final demand goods were about 30.7 percent of overall final demand, final demand services were roughly 66.6 percent, and final demand construction was about 2.7 percent of final demand. Within intermediate demand, coverage of services for intermediate demand resulted in about a 45 percent increase in coverage of the intermediate demand portion of the economy.
FD-ID indexes are constructed from commodity-based producer output price indexes. Commodities are allocated to aggregate indexes primarily based on the type of buyer. The main source of data used to determine the type of buyer is the “Use of commodities by industries, before redefinition,” table from the Benchmark Input-Output Accounts of the U.S. In many cases, the same commodity is purchased by different types of buyers. As a result, commodities are often included in several FD-ID indexes. For example, regular gasoline is purchased for personal consumption, export, government use, and business use. The PPI program publishes only one commodity index for regular gasoline (wpu057104), reflecting sales to all types of buyers, and this index is used in all aggregations regardless of whether the gasoline is sold for personal consumption, as an export, to government, or to businesses. Proportions based on BEA “Use of Commodities” data are used to allocate the correct portion of the total weight of gasoline to each use category. In cases when buyer type is an important price determining characteristic, indexes are created based on specific buyer type. For example, within the PPI category for loan services, separate indexes for consumer loans and business loans were constructed. For more information relating to the FD-ID structure, see “A new, experimental system of indexes from the PPI program” in the February 2011 Monthly Labor Review.
Final Demand
The final demand portion of the FD-ID structure measures price change for commodities sold for personal consumption, capital investment, government, and export. The system is composed of six main price indexes: final demand goods; final demand trade services; final demand transportation and warehousing services; final demand services less trade, transportation, and warehousing; final demand construction; and overall final demand. The final demand goods index measures price change for both unprocessed and processed goods sold to final demand. Fresh fruits sold to consumers and computers sold for capital investment are examples of transactions included in the final demand goods price index.
The final demand trade services index measures price change for the retailing and wholesaling of merchandise sold to final demand, generally without transformation. (Trade indexes measure changes in margins received by wholesalers and retailers.) The final demand transportation and warehousing services index tracks price change for transportation of passengers, as well as, transportation of cargo sold to final demand, and also includes prices for warehousing and storage of goods sold to final demand. The final demand services less trade, transportation, and warehousing index measures price change for all services other than trade and transportation sold to final demand. Publishing, banking, lodging, and health care are examples of these services. The final demand construction index tracks price change for new construction, as well as maintenance and repair construction sold to final demand. Construction of office buildings is an example of a commodity that would be included in the final demand construction index. Lastly, the overall final demand index tracks price change for all types of commodities sold to final demand by combining the five final demand component indexes described above.
Intermediate Demand
The intermediate demand portion of the FD-ID system tracks price change for goods, services, and construction products sold to businesses as inputs to 7 production, excluding capital investment. The system includes two parallel treatments of intermediate demand. The first treatment organizes intermediate demand commodities by type. The second organizes intermediate demand commodities into production stages, with the explicit goal of developing a forward-flow model of production and price change.
The intermediate demand by commodity type portion of the system organizes commodities by similarity of product. The system is composed of six main price indexes: unprocessed goods for intermediate demand; processed goods for intermediate demand; intermediate demand trade services; intermediate demand transportation and warehousing services; intermediate demand services less trade, transportation, and warehousing; and intermediate demand construction.
The unprocessed goods for intermediate demand price index measures price change for goods sold to businesses as inputs to production that have undergone no fabrication. Crude petroleum sold to refineries is an example of an unprocessed good sold to intermediate demand. The processed goods for intermediate demand index tracks price change for fabricated goods sold as business inputs. Examples include car parts sold to car manufacturers and gasoline sold to trucking companies. The index for trade services for intermediate demand measures price change for the services of retailing and wholesaling goods purchased by businesses as inputs to production.
The intermediate demand transportation and warehousing services index measures price change for business travel, as well as, transportation and warehousing of cargo sold to intermediate demand. The intermediate demand services less trade, transportation, and warehousing index measures price change for services other than trade, transportation, and warehousing sold as inputs to production. Legal and accounting services purchased by businesses are examples of intermediate demand services excluding trade, transportation, and warehousing. Finally, the construction for intermediate demand index measures price change for construction purchased by firms as inputs to production. The index for construction for intermediate demand tracks price change for maintenance and repair construction purchased by firms.
Comparing the PPI with CPI
Although some data users utilize the PPI as a potential indicator of the Consumer Price Index (CPI), there are many reasons why the PPI and the CPI may diverge.
The scope of the personal consumption portion of the PPI includes all marketable output sold by domestic producers for households. The scope of the CPI includes goods and services provided by business or government, where explicit user charges are paid by consumers. For example, the most heavily weighted item in the CPI, owners’ equivalent rent, is excluded from the PPI. The scope of the CPI includes imports. The PPI excludes imports.
The CPI only includes components of personal consumption directly paid for by the consumers, while the PPI includes components of personal consumption that may not be paid for by consumers. For example, the PPI includes medical services paid for by third parties. In contrast to CPI, PPI does not completely cover services. PPIs exclude taxes, since they do not represent producer revenue. Conversely, sales and other taxes paid by consumers are part of household expenditure and are included in the CPI. Additional technical differences between PPI and CPI also exist. For more information see “Comparing new final demand producer price indexes with other Government price indexes,” Monthly Labor Review, January 2014, at www.bls.gov/opub/mlr/
Final demand goods
- The index for final demand goods moved up 0.9 percent in September, the third consecutive increase.
- Nearly three-quarters of the broad-based September advance is attributable to a 3.3- percent rise in prices for final demand energy.
- The indexes for final demand foods and for final demand goods less foods and energy moved up 0.9 percent and 0.1 percent, respectively.
- Product detail: Over 40 percent of the September increase in prices for final demand goods can be traced to a 5.4-percent rise in the index for gasoline.
- Prices for jet fuel, processed young chickens, meats, electric power, and diesel fuel also advanced.
- In contrast, the index for fresh and dry vegetables declined 13.9 percent.
- Prices for wood pulp and for utility natural gas also fell.
Final demand services
- The index for final demand services advanced 0.3 percent in September following a 0.2-percent rise in August.
- Over 60 percent of the September increase is attributable to prices for final demand services less trade, transportation, and warehousing, which climbed 0.3 percent.
- The index for final demand trade services moved up 0.5 percent. (Trade indexes measure changes in margins received by wholesalers and retailers.)
- Conversely, prices for final demand transportation and warehousing services declined 0.4 percent.
Product detail
- A 13.9-percent jump in the index for deposit services (partial) was a major factor in the September rise in prices for final demand services.
- The indexes for machinery, equipment, parts, and supplies wholesaling; health, beauty, and optical goods retailing; traveler accommodation services; outpatient care (partial); and application software publishing also moved higher.
- In contrast, prices for airline passenger services fell 2.1 percent.
- The indexes for automobile retailing (partial) and for bundled wired telecommunications access services also decreased.
Intermediate Demand by Commodity Type
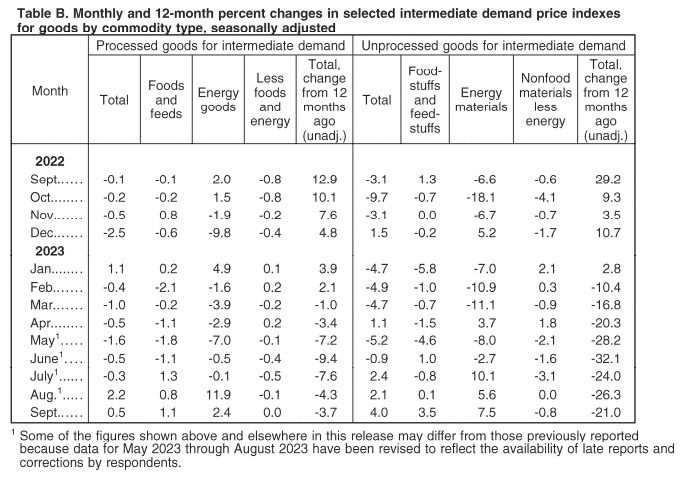
- Within intermediate demand in September, prices for processed goods advanced 0.5 percent, the index for unprocessed goods rose 4.0 percent, and prices for services moved up 0.3 percent.
Processed goods for intermediate demand
- The index for processed goods for intermediate demand increased 0.5 percent in September after rising 2.2 percent in August.
- Most of the September advance is attributable to prices for processed energy goods, which jumped 2.4 percent.
- The index for processed foods and feeds moved up 1.1 percent, while prices for processed materials less foods and energy were unchanged.
- For the 12 months ended in September, the index for processed goods for intermediate demand fell 3.7 percent.
Product detail
- A major factor in the September increase in prices for processed goods for intermediate demand was the index for diesel fuel, which advanced 2.5 percent.
- Prices for gasoline, jet fuel, liquefied petroleum gas, processed young chickens, and fatty acids also moved higher.
- Conversely, the index for steel mill products decreased 3.7 percent.
- Prices for natural gas to electric utilities and for soybean cake and meal also declined.
Unprocessed goods for intermediate demand
- The index for unprocessed goods for intermediate demand rose 4.0 percent in September, the third consecutive increase.
- Over 70 percent of the September advance can be traced to a 7.5-percent jump in prices for unprocessed energy materials.
- The index for unprocessed foodstuffs and feedstuffs moved up 3.5 percent. In contrast, prices for unprocessed nonfood materials less energy fell 0.8 percent.
- For the 12 months ended in September, the index for unprocessed goods for intermediate demand decreased 21.0 percent.
Product detail
- Seventy percent of the September rise in prices for unprocessed goods for intermediate demand can be attributed to the index for crude petroleum, which increased 10.1 percent.
- Prices for raw milk; slaughter chickens; hay, hayseeds, and oilseeds; slaughter cattle; and recyclable paper also advanced.
- Conversely, the index for nonferrous scrap fell 0.8 percent. Prices for corn and for wheat also declined.
Services for intermediate demand
- The index for services for intermediate demand increased 0.3 percent in September after no change in August.
- Nearly 60 percent of the broad-based September advance is attributable to prices for services less trade, transportation, and warehousing for intermediate demand, which rose 0.3 percent.
- The indexes for transportation and warehousing services for intermediate demand and for trade services for intermediate demand moved up 0.7 percent and 0.2 percent, respectively.
- For the 12 months ended in September, prices for services for intermediate demand increased 4.1 percent.
Product detail
- A 4.0-percent rise in the index for gross rents of retail properties was a major factor in the September advance in prices for services for intermediate demand.
- The indexes for deposit services (partial); machinery and equipment parts and supplies wholesaling; arrangement of freight and cargo transportation; investment banking; and hardware, building materials, and supplies retailing also rose.
- In contrast, prices for loan services (partial) decreased 2.0 percent.
- The indexes for metals, minerals, and ores wholesaling and for airline passenger services also fell.
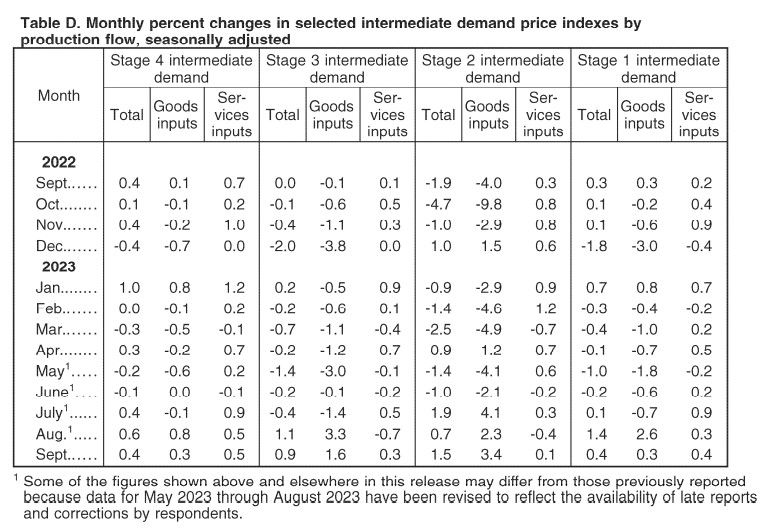
Intermediate Demand by Production Flow
Stage 4 intermediate demand
Prices for stage 4 intermediate demand increased 0.4 percent in September, the third consecutive rise. In September, the index for total services inputs to stage 4 intermediate demand advanced 0.5 percent, and prices for total goods inputs moved up 0.3 percent. (See table D.) Increases in the indexes for gross rents of retail properties, deposit services (partial), machinery and equipment parts and supplies wholesaling, gasoline, investment banking, and for commercial and industrial machinery and equipment repair and maintenance outweighed declines in the indexes for loan services (partial); grains; and metals, minerals, and ores wholesaling. For the 12 months ended in September, prices for stage 4 intermediate demand rose 2.4 percent.
Stage 3 intermediate demand
The index for stage 3 intermediate demand advanced 0.9 percent in September after moving up 1.1 percent in August. In September, prices for total goods inputs to stage 3 intermediate demand rose 1.6 percent, and the index for total services inputs increased 0.3 percent. Higher prices for raw milk, slaughter chickens, jet fuel, deposit services (partial), diesel fuel, and arrangement of freight and cargo transportation outweighed declines in the indexes for grains, loan services (partial), and television advertising time sales. For the 12 months ended in September, prices for stage 3 intermediate demand fell 3.2 percent.
Stage 2 intermediate demand
The index for stage 2 intermediate demand rose 1.5 percent in September, the third consecutive increase. In September, prices for total goods inputs to stage 2 intermediate demand jumped 3.4 percent, and the index for total services inputs edged up 0.1 percent. Advances in the indexes for crude petroleum, deposit services (partial), gas fuels, oilseeds, arrangement of freight and cargo transportation, and machinery and equipment parts and supplies wholesaling outweighed decreases in prices for loan services (partial), broadcast and network television advertising time sales, and wood pulp. For the 12 months ended in September, the index for stage 2 intermediate demand declined 6.9 percent.
Stage 1 intermediate demand
The index for stage 1 intermediate demand moved up 0.4 percent in September after advancing 1.4 percent in August. In September, the index for total services inputs to stage 1 intermediate demand rose 0.4 percent, and prices for total goods inputs climbed 0.3 percent. Increases in the indexes for gross rents of retail properties; diesel fuel; hardware, building materials, and supplies retailing; gasoline; investment banking; and traveler accommodation services outweighed decreases in the indexes for grains; metals, minerals, and ores wholesaling; and airline passenger services. For the 12 months ended in September, prices for stage 1 intermediate demand fell 1.0 percent.

TLDRS:
- The Bureau of Labor Statistics released the Producer Price Index for final demand for September.
- The Producer Price Index for final demand increased 0.5 percent in September, seasonally adjusted.
- The index for final demand advanced 2.2 percent for the 12 months ended in September, the largest increase since moving up 2.3 percent for the 12 months ended in April.
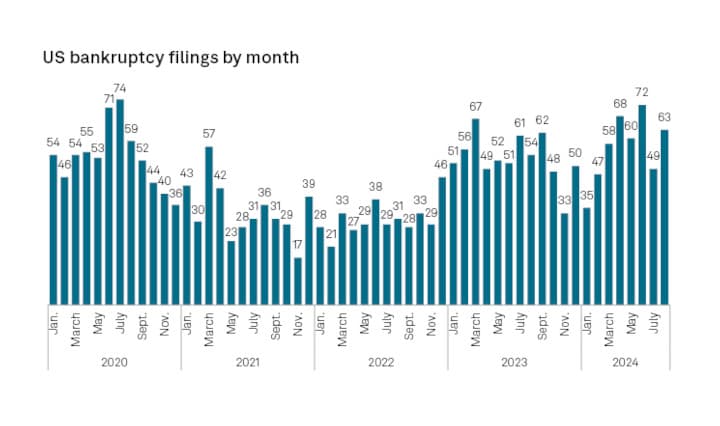
- Reminder, while banks have the liquidity fairy, 'we' get the promise of 2 more rate hikes this year, Atlanta Fed President Raphael Bostic yet again enrichens himself inappropriately from his position.
- To fix one end of their mandate (price stability) from the inflation problem they created, the Fed will continue sacrificing employment (the other end of their mandate) to bolster price stability by continuing to raise interest rates--causing further stress to businesses and households.
- I believe inflation is the match that has been lit that will light the fuse of our rocket.