Multivariate Core Trend (MCT) inflation increased to 2.5% in July from 2.2% in June. The MCT gauges inflation’s persistence across 17 core sectors of the personal consumption expenditures (PCE) price index.
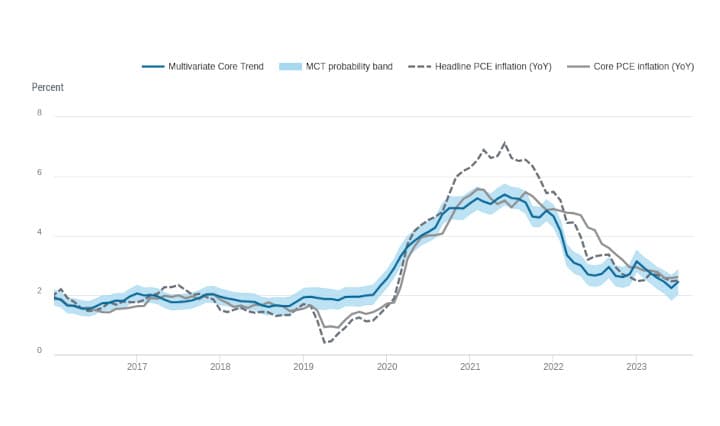
Inflation measured by the Multivariate Core Trend (MCT) model increased to 2.5% in July, up from a revised 2.2% in June, signaling growing inflationary pressure. The MCT, which gauges inflation’s persistence across 17 core sectors of the personal consumption expenditures (PCE) price index, indicated that the probability band for inflation stood between 2.0% and 2.9%.
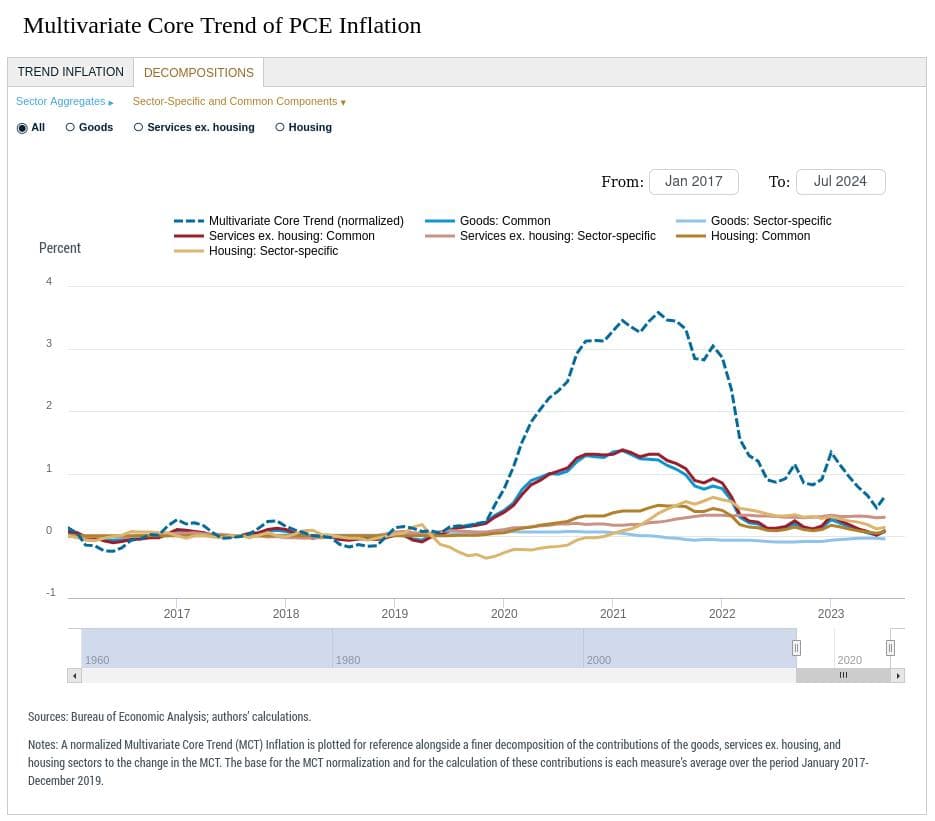
The rise in MCT inflation was primarily driven by the housing sector, contributing 0.22 percentage points (ppt) to the increase relative to its pre-pandemic average. Services excluding housing made an even larger impact, contributing 0.39 ppt, while core goods added a smaller 0.05 ppt. Inflation persistence was largely driven by sector-specific factors within services excluding housing, underscoring the unique inflationary trends within services where about ~2/3 of consumer spending occurs.
The MCT model offers a dynamic factor analysis to assess how inflationary pressures are spread across sectors, providing key insights for policymakers looking to understand the breadth and drivers of inflation. This model also accounts for outliers and changing relationships over time, making it a valuable tool for evaluating inflation trends and pressures and at this moment, it is showing that inflation is back on the upswing...

TLDRS:
- Inflation measured by the Multivariate Core Trend (MCT) model rose to 2.5% in July, up from a revised 2.2% in June.
- The housing sector contributed 0.22 percentage points (ppt) to the increase relative to its pre-pandemic average.
- Services excluding housing had a larger impact, contributing 0.39 ppt to the increase.
- Core goods made a smaller contribution of 0.05 ppt.
- This model accounts for outliers and changing relationships over time, making it a useful tool for evaluating inflation trends and pressures of the Fed's preferred inflation gauge, and at this moment, it is showing inflation is back on the upswing...

Multivariate Core Trend (MCT) inflation increased to 2.5% in July from 2.2% in June. The MCT gauges inflation’s persistence across 17 core sectors of the personal consumption expenditures (PCE) price index. The Fed's preferred inflation gauge is growing...https://t.co/eAxszO1g78
— dismal-jellyfish (@DismalJellyfish) September 4, 2024