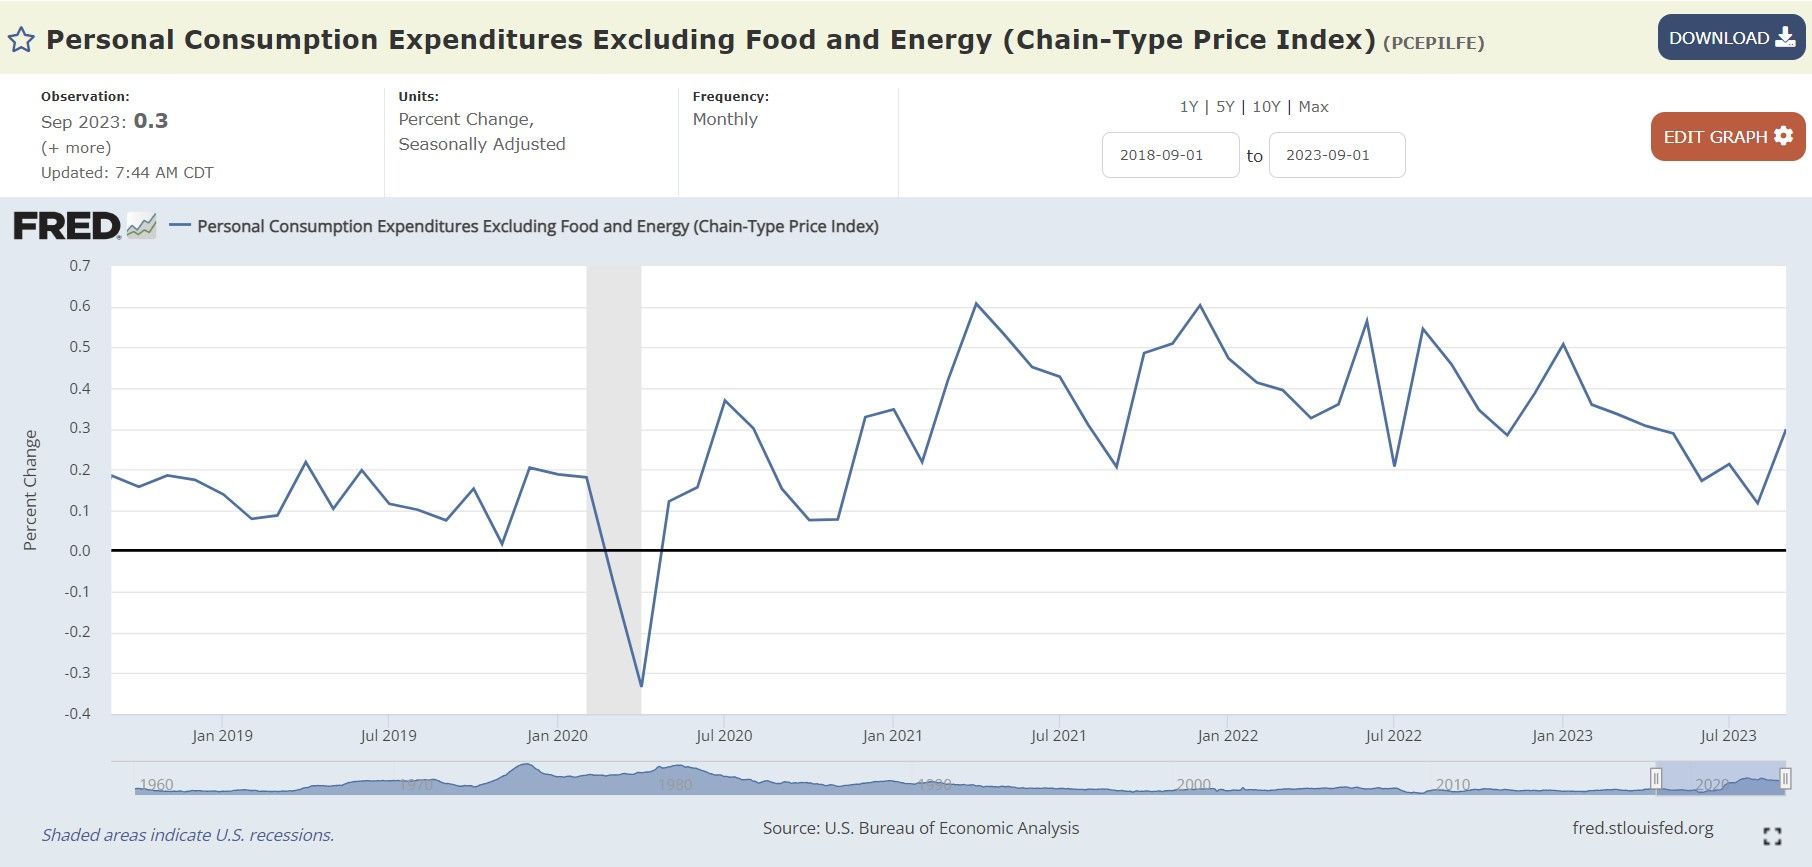
The Fed’s Favored Core PCE Price Index was up 0.4% in September and is still stuck in the inflationary doldrums. Inflation is not being tamed!
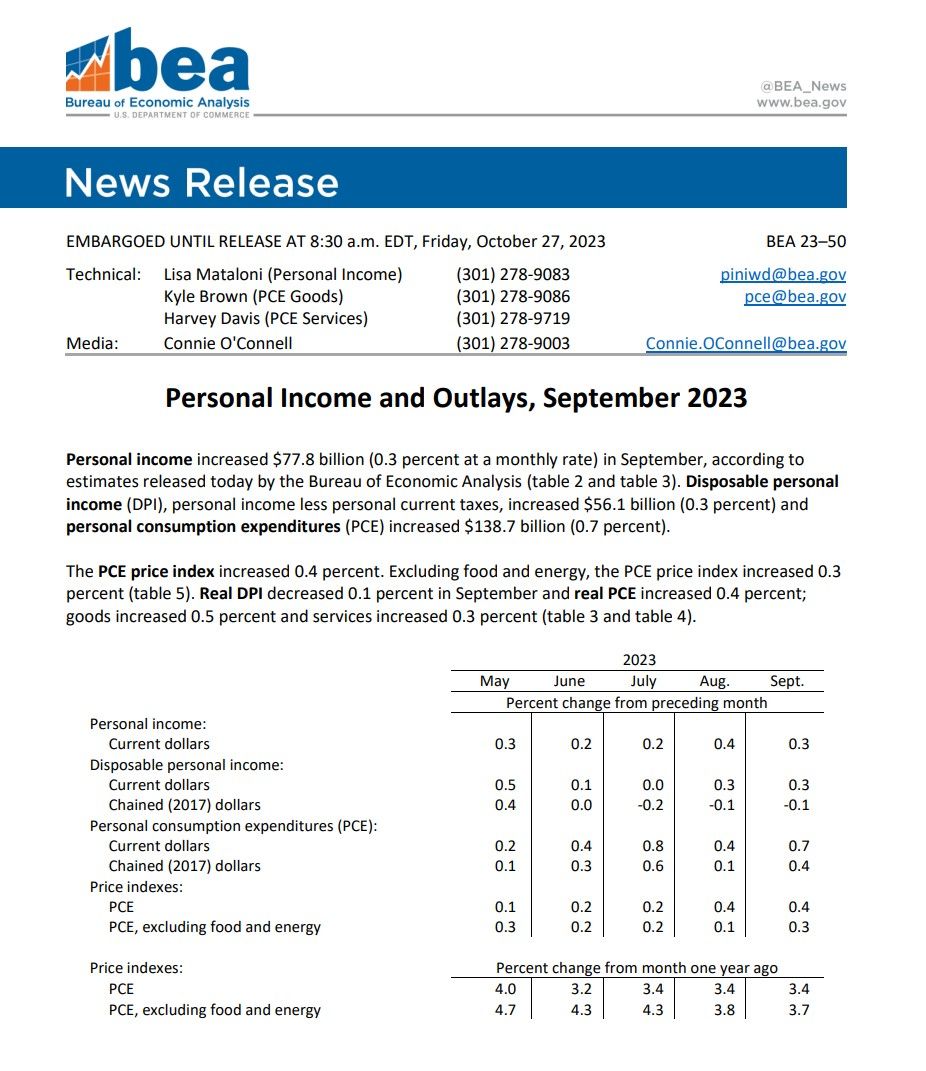
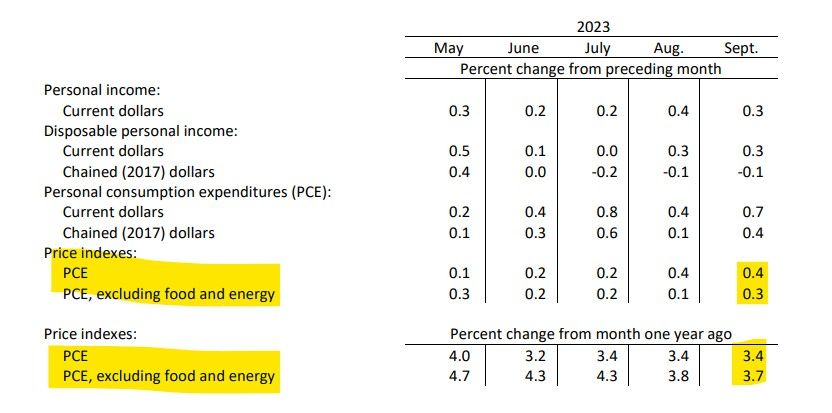
The inflation index most favored by the Fed and the one they base policy actions off of, the core PCE price index (excludes food and energy products), re-accelerated in September from August (0.1% to 0.3%), as consumers continue to spend more and more on goods and services:
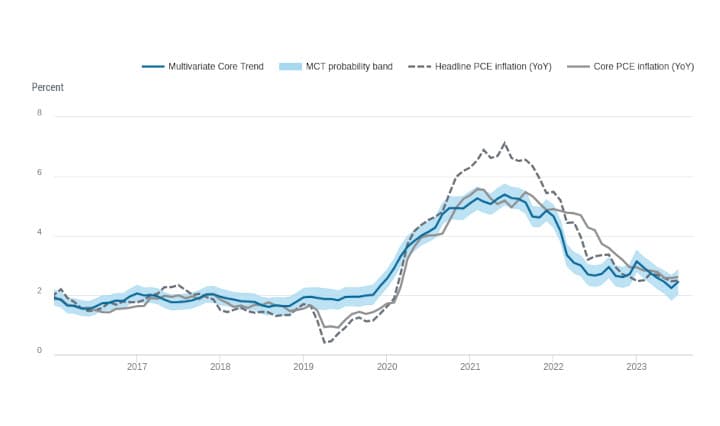
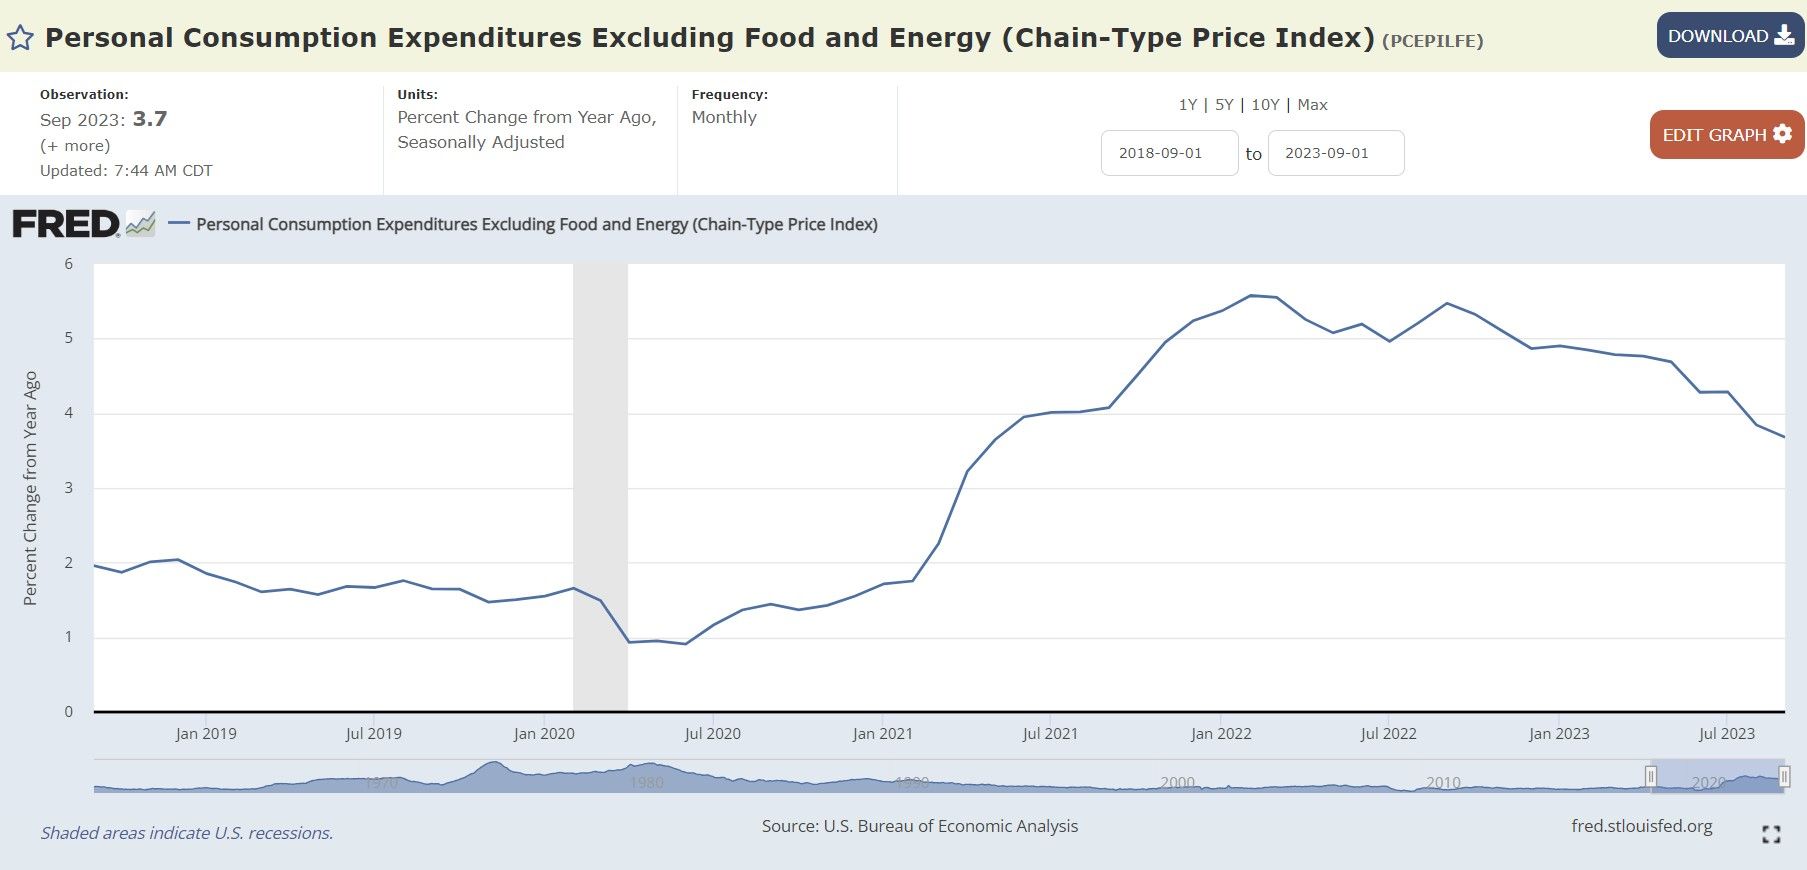
Inflation is 'transitory' in the sense that it is making its way from product category to product category, falling here but popping up again higher than before. And so the core PCE price index continues to be stuck ABOVE the preferred 2% level, meaning the Fed has more work to do on the inflation front if they are serious about taming it.
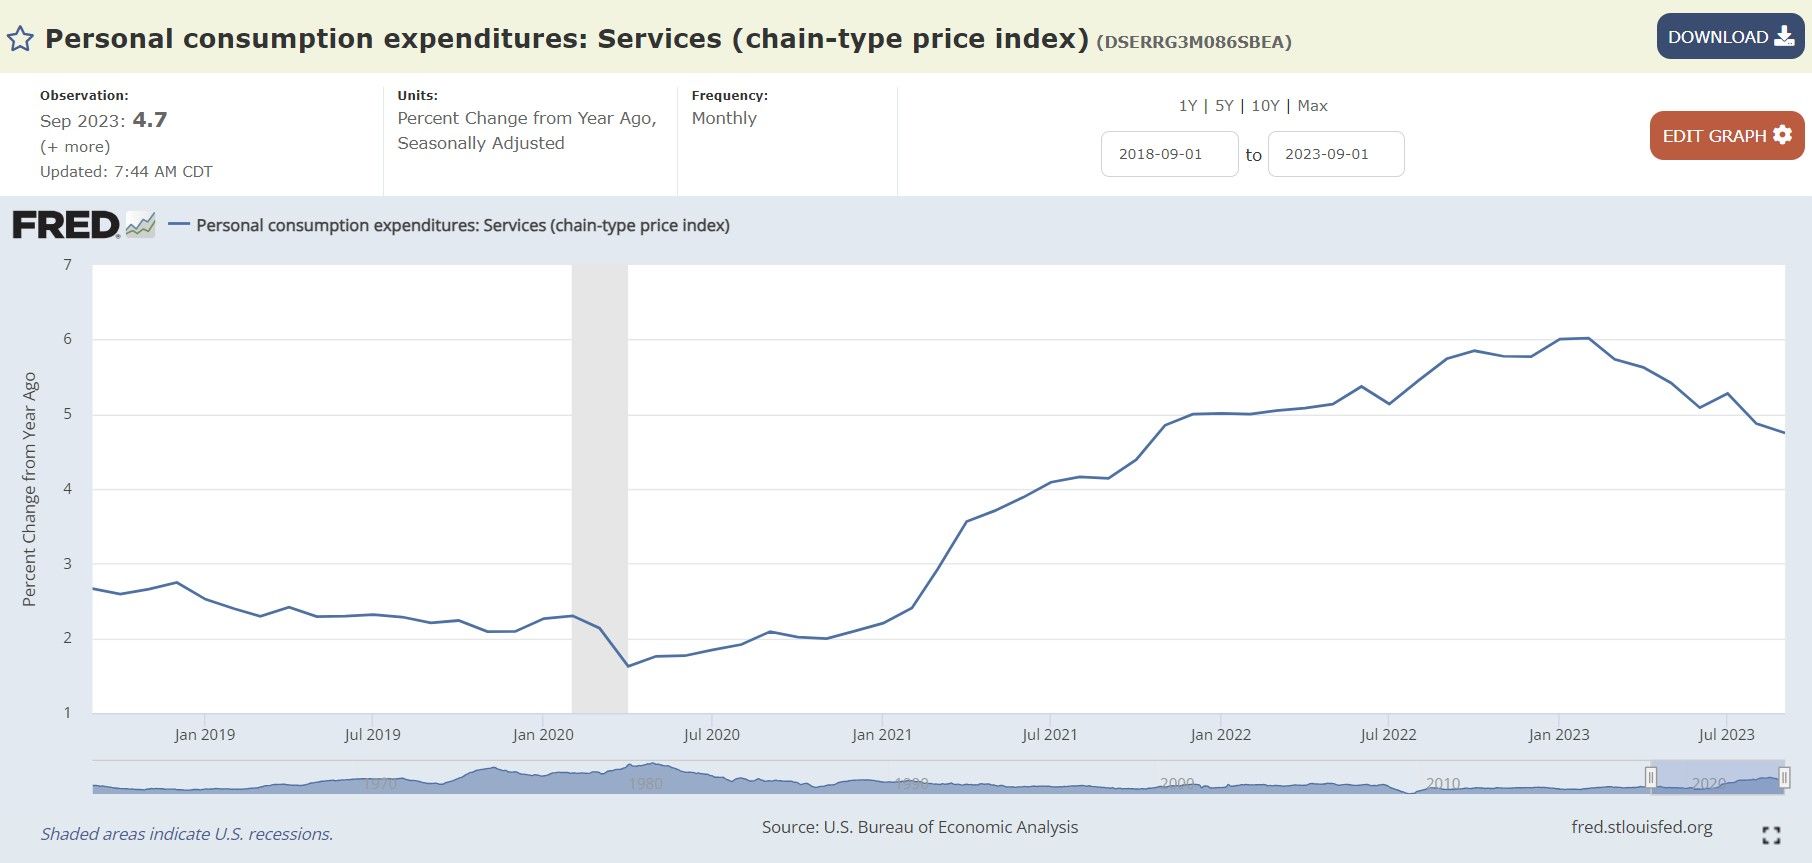
On a year-over-year basis, the core PCE price index is 3.7% (still almost DOUBLE the target), and only slightly down from August's 3.8% reading. It has now gone sideways at just under 5% and now lower than 3.64% since May of 2021 for nearly two years now and is still growing (with corporate media celebrating it is not growing as fast).
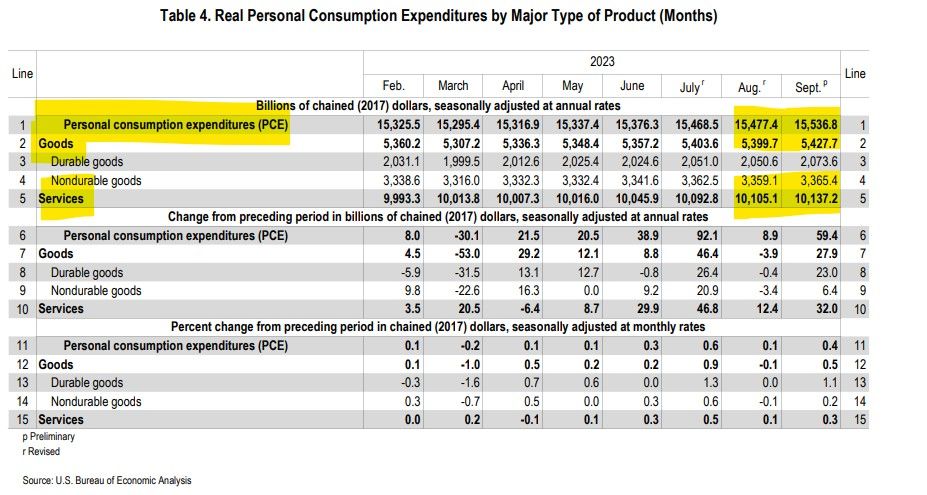
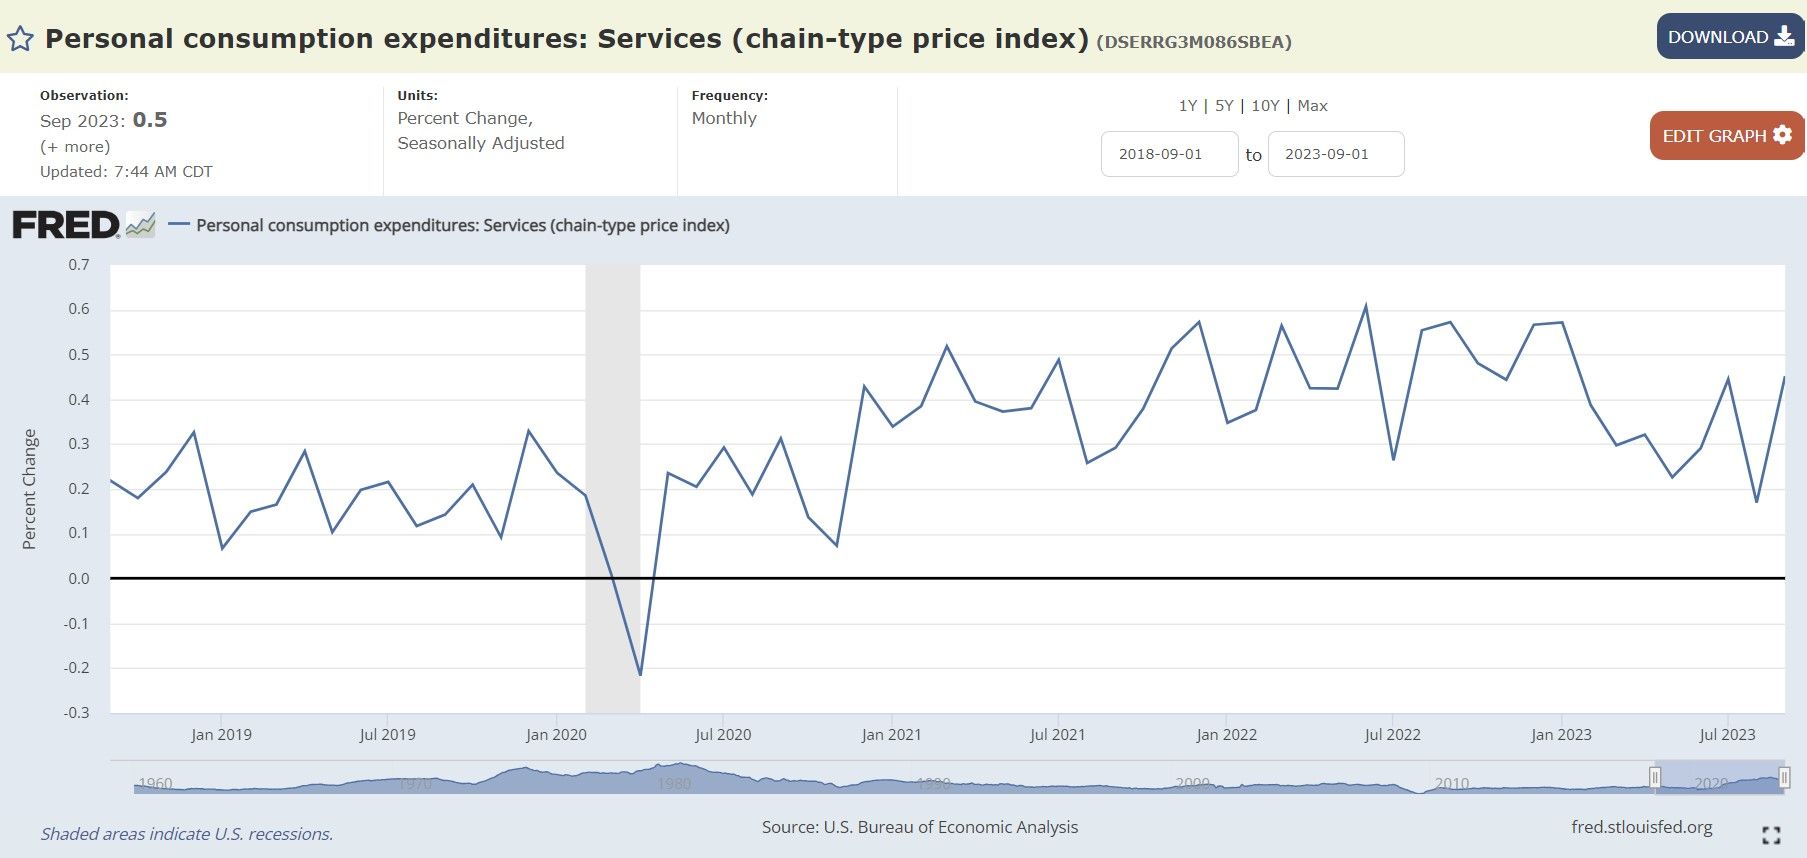
Inflation in services picked up speed from August into September
Remember, services is where the majority of consumer spending ends up at the end of the day. Folks are paying more and more each month for things like healthcare, housing, utilities, education, entertainment, restaurants, travel, streaming services, internet, cellphones, haircuts, etc.
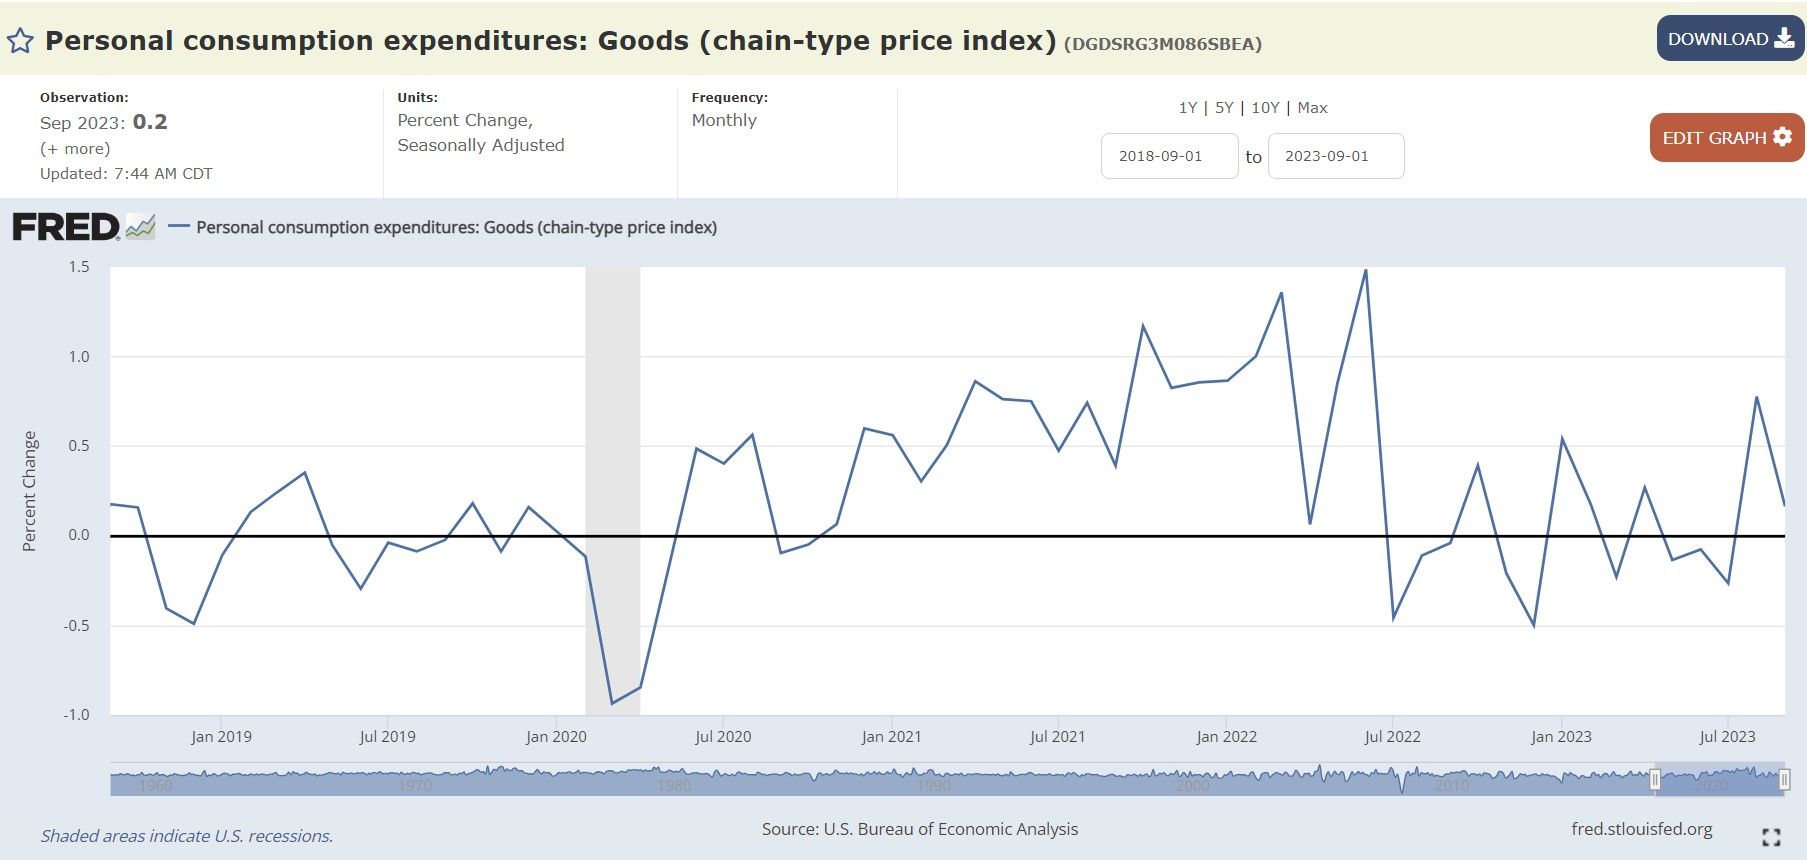
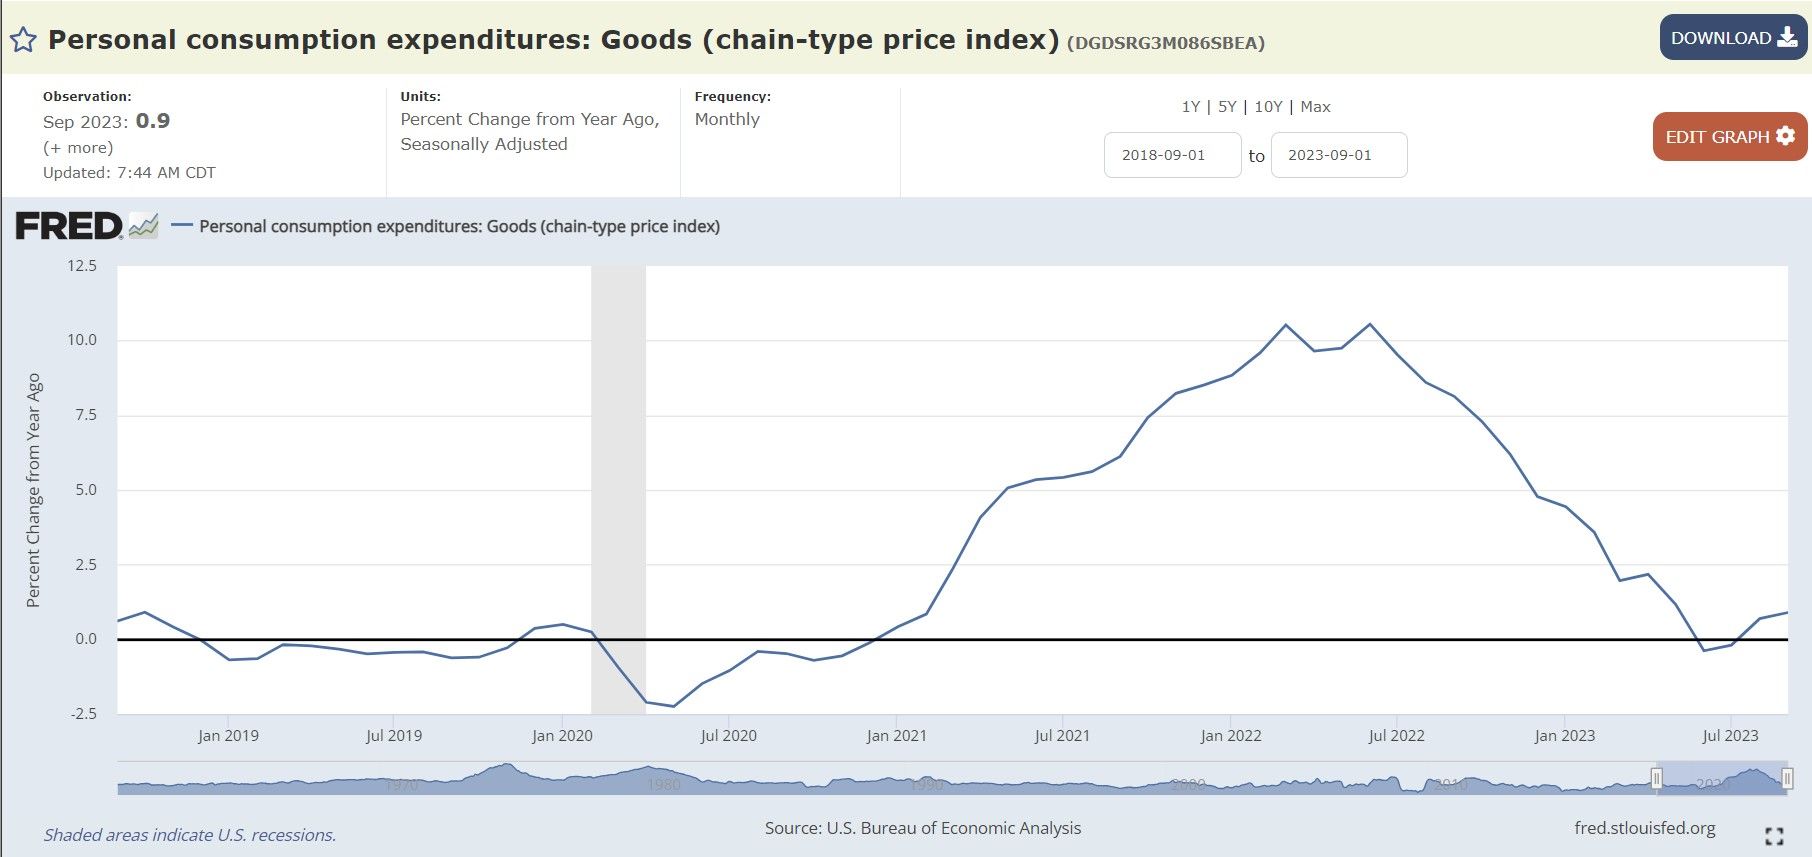
The price for goods was down from August but still increasing. Notice for year over year how goods are back on a 'positive' track?
The PCE price index for food was up 0.3% for the month and 2.7% for the year.
The PCE price index for energy prices increased 1.7% for the month and down -0.1% year over year.
Personal saving was $687.7 billion in September and the personal saving rate—personal saving as a percentage of disposable personal income—was 3.4%
Why is this interesting? Personal saving was $776.9 billion in Q3, compared with $1.04 trillion in the Q2. Now, less than a month later, savings are down almost another $100 billion dollars while spending on credit is through the roof to make up for it. Yikes!
Fed's Jefferson on core nonhousing services inflation: "Since this segment accounts for more than 50% of the overall core PCE index, we will need to see further slowing in this area to meet our inflation objective."
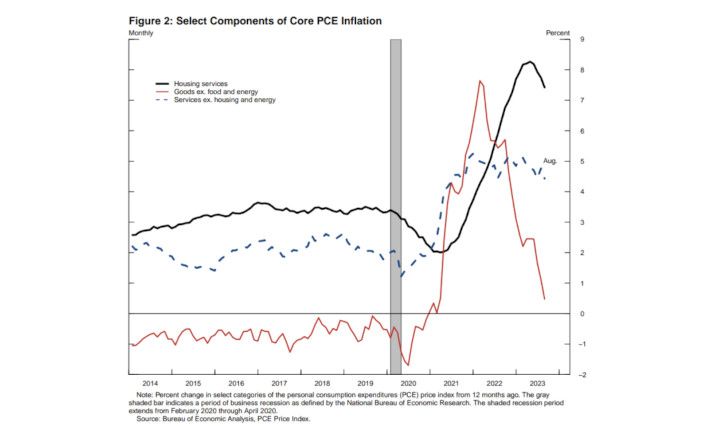
"Since this segment accounts for more than 50 percent of the overall core PCE index, we will need to see further slowing in this area to meet our inflation objective."
As we have covered above, the Fed is not making marked progress on Core PCE Inflation as it appears caught in the doldrums going 2+ years now.
How come our personal experiences with prices are higher than what is reported?
Three of the reasons for this are ‘owners’ equivalent rent of residences’, ‘hedonic quality adjustments', and last years insurance adjustment.
I highly recommend reading each of the linked articles, as I am sure they are going to explain this way better than I fear I am about to butcher!
Owners' equivalent rent: For example, Rent increased by 0.5%, and owners' equivalent rent (for homeowners) rose by 0.4%. So, why is this significant price inflation not reflected in the CPI report? The answer is simple: it's not adequately tracked. The CPI relies on surveys and homeowners' perception of potential rental values, rather than actual rental income. This component accounts for about one-third of the overall CPI and is included as a service.
Hedonic quality adjustments: The Bureau of Labor Statistics (BLS) incorporates "hedonic quality adjustments" to account for improvements in products over time. For example, when a car's six-speed manual transmission is upgraded to a 10-speed electronically controlled transmission. Price increases associated with these quality improvements are removed from the CPI calculations for both new and used vehicles.
The CPI is designed to measure price changes of the same item over time. However, when an item improves, it is no longer considered the same item, and the price increase is not inflation but rather reflects a theoretically better product.
Additionally, every year in October, there's a change made to how they measure the cost of health insurance. This change is spread out over the next 12 months. This started last October and will ended this past September.
Figuring out how much health insurance costs can be tricky. It's not just about how much you pay monthly (premiums) but also other costs like when you visit the doctor (co-pays) or the maximum amount you might have to pay in a year (out-of-pocket maximums). Plus, there are so many different insurance plans, and they can be different depending on where you live.
The Bureau of Labor Statistics is tasked with measuring these costs, uses a special method to estimate these changes. Every fall, they adjust their numbers based on new information. They look at how much insurance companies earn and use that to make their estimates. This means that the monthly changes in health insurance costs are pretty much the same for a whole year, and then they change it up again.
Usually, this yearly change isn't a big deal. But last year, the change was massive and had some big effects (artificially pushing CPI down for health).
For the year leading up to September 2022, the way they measured the cost of health insurance was a bit off. By that September, they said health insurance costs had gone up by 28% compared to the year before, which made it seem like prices were rising really fast.
But then in October 2022, they made their yearly change, and suddenly the numbers showed that health insurance costs were dropping every month. Medical Care/Insurance making up over 6% of total CPI being reported artificially low has suppressed CPI in this category and overall.
However, as called out, this is going away. This month, BLS will make a new adjustment that will be applied to health insurance CPI for 12 months through September 2024 that will swing the other way.
This will of course start to bleed into PCE as time goes on.
In reality, all three of these practices result in a purposeful and bipartisan understatement of inflation and raises questions about whether the intention is to keep the general public uninformed.

TLDRS:
- The Fed’s Favored Core PCE Price Index was up 0.4% in September and is still stuck in the inflationary doldrums. Inflation is not being tamed!
- Personal savings continue to drop.
- The Fed is not making marked progress on Core PCE Inflation as it appears caught in the doldrums going 2+ years now.
- Reminder, while banks have the liquidity fairy, 'we' get the promise of 2 more rate hikes this year, Atlanta Fed President Raphael Bostic yet again enrichens himself inappropriately from his position.
- To fix one end of their mandate (price stability) from the inflation problem they created, the Fed will continue sacrificing employment (the other end of their mandate) to bolster price stability by continuing to raise interest rates--causing further stress to businesses and households.
- I believe inflation is the match that has been lit that will light the fuse of our rocket.