Inflation Alert! From the Transportation Statistics Annual Report 2022: Container freight rates have dropped from their peak but are still up 211% from pre-pandemic levels, CPI for Overall Transportation increasing (again), extreme weather impacts & more
The Bureau of Transportation Statistics (BTS) today released the 28th edition of the Transportation Statistical Annual Report (TSAR). The report is a collection of key transportation indicators along with an overview of the transportation system, to display ongoing technological change, shifting national priorities, and cultural, demographic, and economic challenges that have altered expectations of what is important to report to transportation stakeholders. Focus areas that reflect the topics in BTS’s legislative mandate that include:
- State of the System,
- Passenger Travel and Equity,
- Freight and Supply Chain,
- Transportation Economics,
- Transportation Safety,
- Energy and Sustainability
Container freight rates:
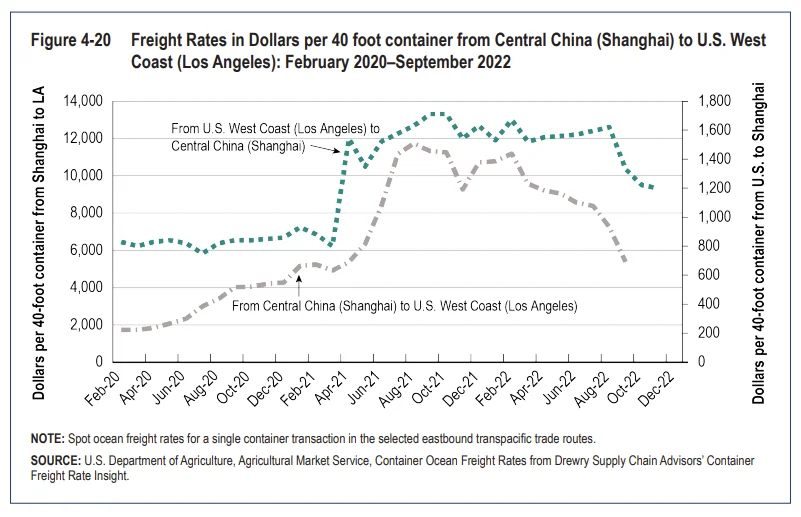
Still, as called out in the headline, Ocean freight rates as of October 2022 remain 211% above the pre-pandemic rate.
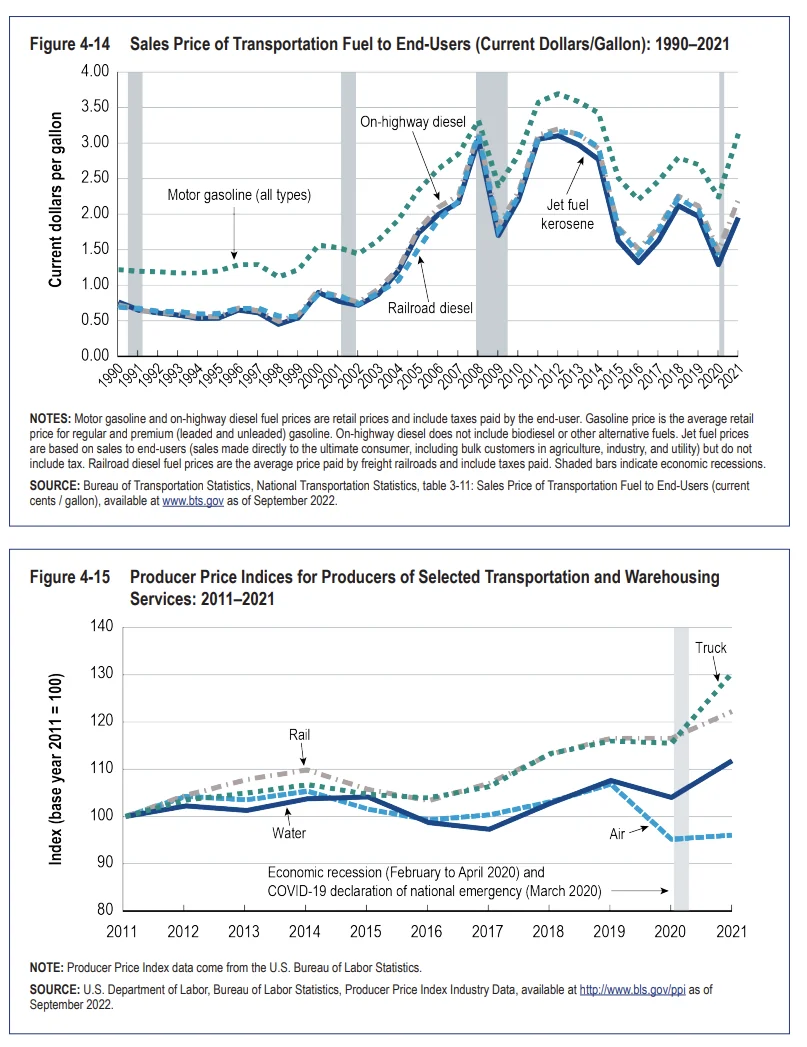
Cost of Transportation
In 2021, the costs for rail, truck, and water transportation services reached their all-time high level. Truck transportation service saw the largest price increase of 12.8 percent from 2020 to 2021, followed by water (7.5 percent) and rail transportation (4.9 percent). Air transportation saw the smallest increase of 0.9 percent after experiencing the largest decrease of 10.9 percent in 2020.
Fuel Prices:
Fuel prices are a cost to industries that produce transportation services as well as to consumers. These industries embed the costs in the price they charge businesses and households—for the transportation services they provide for a fee. The period spanning 2020 to 2021 had the largest year-over-year increase in inflation adjusted terms for motor gasoline (all types) and the second largest increase for jet fuel and onhighway diesel since 1990.
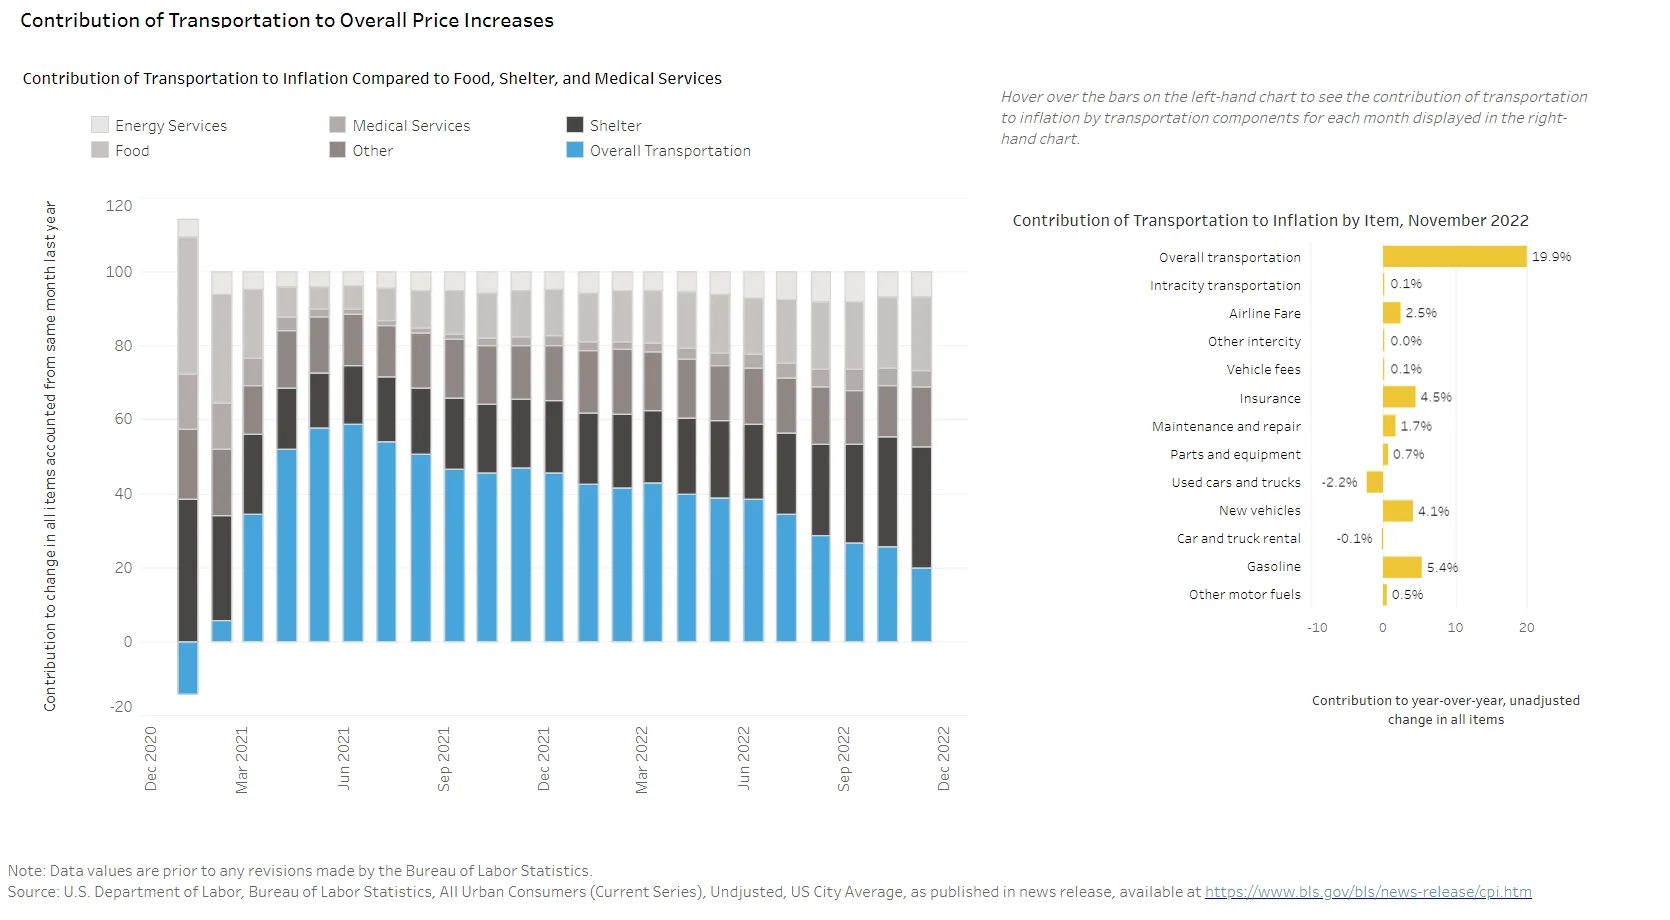
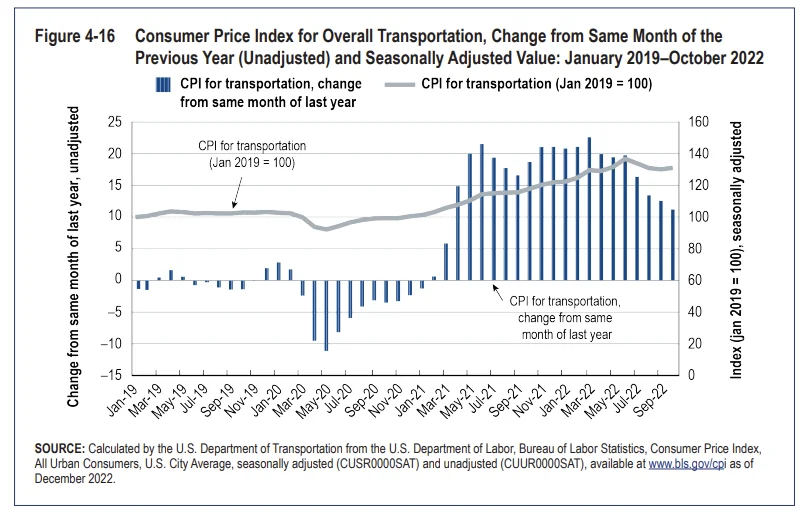
After steadily increasing since June 2020 to reach a new high in June 2022, the seasonally adjusted transportation CPI began to decline in June 2022 (Figure 4-16 below) —falling for three consecutive months before increasing again in October 2022...
We have talked about extreme weather events and their effect on supply chains before, however this report has quite an illustration of what it means for inflation as well:
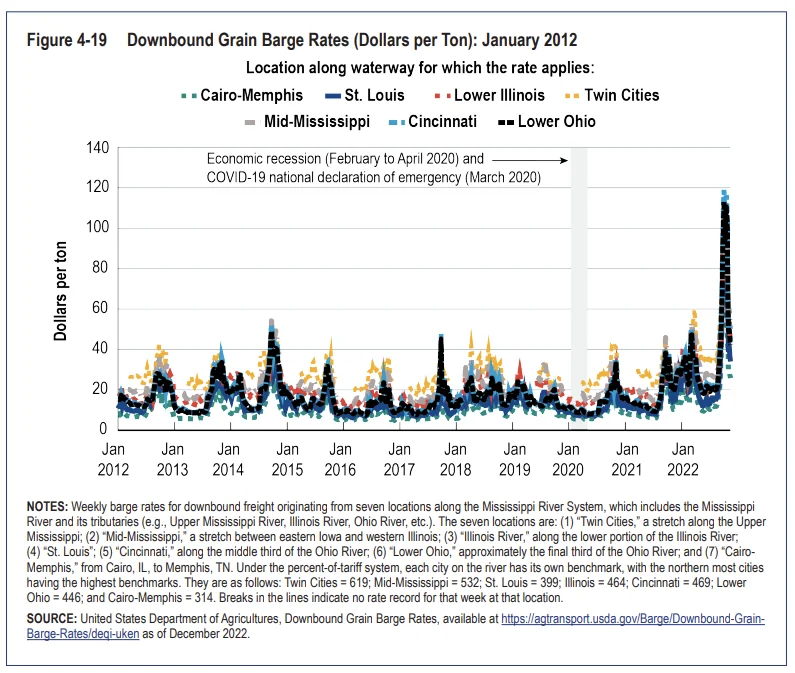
Despite fuel price increases in 2021, downbound barge rates remained fairly stable in 2021, hovering around $20 per ton, before increasing in the fall of 2022 when the Mississippi River fell to record low levels.
External factors likewise contributed to the rise in ocean freight rates, which we talked about above.
Other interesting notes:
In 2022, downbound (southbound) grain shipments from the Upper Mississippi through Lock 27, the southernmost lock on the river, followed the 2021 pattern through October, but many of those shipments have stalled or been on the Lower River. Unfortunately, disruptions to freight flow caused by low water have coincided with the peak shipping season for U.S. corn and soybeans, the Nation’s largest export crops. The October downbound grain and agricultural product shipments on the Lower Mississippi below Lock and Dam 27 were predominately soybeans and corn, leaving those major export commodities most vulnerable to the Lower River disruption. The implications of stalled shipments are apparent in barge shipping rates. By early September, barge rates were already at record highs.
World demand and prices for grain have been rising due to Russia’s invasion of Ukraine, drought in other producing areas, and increased consumption in China and elsewhere. Yet, despite the demand, U.S. grain and soybean exports are down due in part to the higher U.S. dollar and in part to the delivery delays caused by the compounded impact of low water and disruption to the supply chain. While domestic grain prices remain low, bid prices for U.S. export corn peaked in mid-October as the river delays were at their worst.
Besides delaying loaded downbound barge tows moving from producing areas to destination ports, such as Memphis, South Louisiana, and New Orleans, the low water also delays upbound tows moving fertilizer and cement for spring planting and construction, which also cuts the supply of empty barges for subsequent downbound trips.
Rail shipment is the normal alternative to barges, but the rail system can have difficulty absorbing such a massive short-term shift. Moreover, concerns over a possible rail strike in 2022 made shippers hesitant to rely on a rail option.
From the same month last year, Overall transportation has contributed 19.9% to inflation: