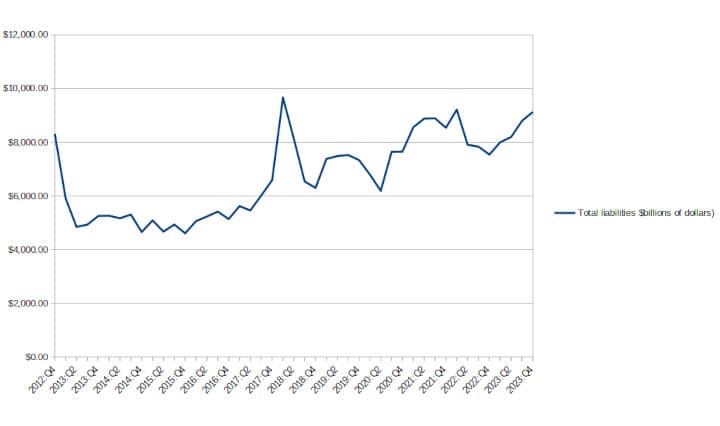
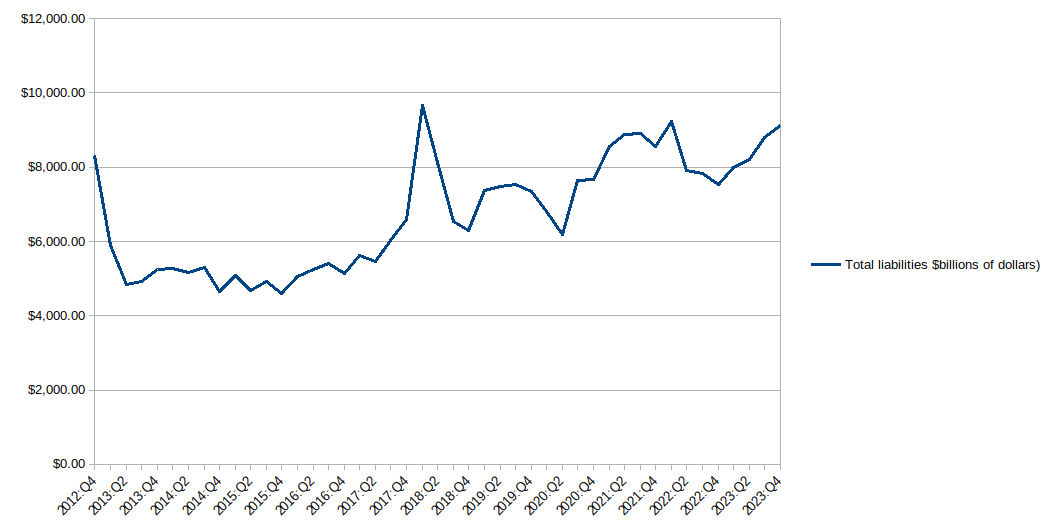
In 2023:Q4 hedge fund liabilities hit $9,131.36 billion (the highest since 2022:Q1) up $333.87 billion from $8,797.49 billion in 2023:Q3.
Today the Fed released Enhanced Financial Account data, which provided various updated insights. For this post I am reviewing the updated hedge fund data for 2023:Q4.
In 2023:Q4 hedge fund liabilities hit $9,131.36 billion (the highest since 2022:Q1) up $333.87 billion from $8,797.49 billion in 2023:Q3.
Hedge funds must file Form PF if they have investment advisors that are registered or are required to register with the Securities and Exchange Commission (SEC), manage one or more private funds, and have at least $150 million in private fund assets under management. Smaller hedge funds file Form PF annually while qualifying hedge funds - those with at least $500 million in assets under management - must file quarterly and report more detail on their assets and liabilities. Commodity pools that elect to file Form PF as hedge funds are included.
Different methodological choices and revisions to Form PF filings can lead to small differences between the hedge funds’ aggregate balance sheet presented here and the SEC’s private fund statistics. The technical Q&A of the Financial Accounts provides more detail on how the hedge fund balance sheet is estimated. The methodology used to estimate the split of the gross asset value on different instruments includes information from Question 26 and 30 of Form PF.
The hedge funds sector has not been fully incorporated in the regular Financial Accounts publication. Hedge funds domiciled abroad are included in the rest of the world sector. In contrast, the assets of domestic hedge funds are usually assigned to the household sector, which is a residual holder on many instruments.
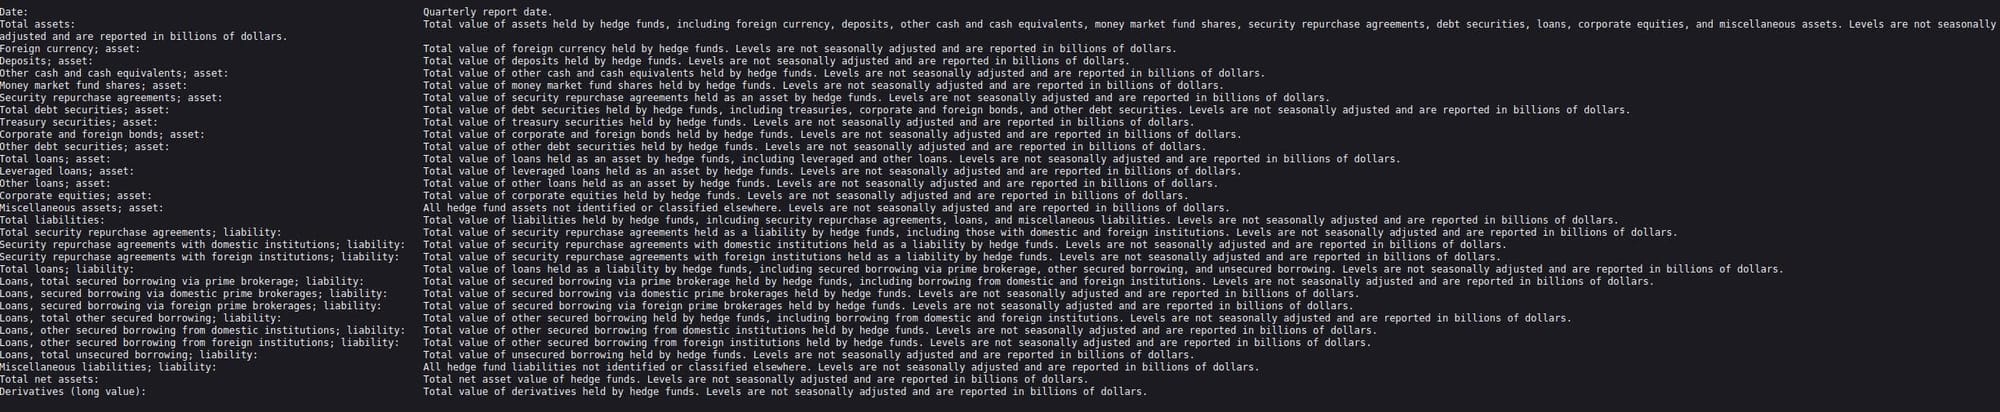
This table shows the aggregate assets and liabilities of hedge funds that file Form PF with the Securities and Exchange Commission. Unlike table B.101.f in the regular Financial Accounts publication, which reports assets and liabilities of domestic hedge funds only, this table presents data on all hedge funds that file Form PF, both domestic and foreign. The first part of the table reports the long position for the respective asset categories, with derivative exposure being excluded. The second part of the table reports the liability items, which detail the source of borrowing:
| Date | Total assets | Foreign currency | asset | Deposits | asset | Other cash and cash equivalents | asset | Money market fund shares | asset | Security repurchase agreements | asset | Total debt securities | asset | Treasury securities | asset | Corporate and foreign bonds | asset | Other debt securities | asset | Total loans | asset | Leveraged loans | asset | Other loans | asset | Corporate equities | asset | Miscellaneous assets | asset | Total liabilities |
| 2012:Q4 | 4254.22 | 51.97 | 116.9 | 309.04 | 74.9 | 347.61 | 1708.78 | 654.49 | 993.65 | 60.64 | 133.35 | 108.84 | 24.5 | 1148.48 | 363.19 | 1834.19 | 602.76 | 294.72 | 308.04 | 976.64 | 764.23 | 599.9 | 164.34 | 209.83 | 139.66 | 70.18 | 2.58 | 254.78 | 2420.03 | 8311.76 |
| 2013:Q1 | 4730.04 | 75.5 | 105.41 | 294.96 | 76.5 | 412.6 | 1943.13 | 755.29 | 1135.47 | 52.37 | 136.66 | 110.51 | 26.15 | 1292.52 | 392.77 | 2137.75 | 657.58 | 306.58 | 350.99 | 1153.52 | 906.42 | 715.64 | 190.78 | 243.46 | 126.91 | 116.56 | 3.64 | 326.65 | 2592.29 | 5901.34 |
| 2013:Q2 | 4852.67 | 71.41 | 117.01 | 320.37 | 77.16 | 543.81 | 1884.54 | 664.46 | 1134.68 | 85.4 | 140.51 | 107.06 | 33.46 | 1332.55 | 365.3 | 2218.16 | 779.21 | 404.37 | 374.84 | 1205.58 | 948.31 | 714.12 | 234.2 | 251.51 | 118.5 | 133 | 5.76 | 233.38 | 2634.51 | 4845.55 |
| 2013:Q3 | 4999.37 | 70.31 | 125.03 | 336.53 | 85.56 | 508.31 | 1902.05 | 673.47 | 1172.01 | 56.56 | 143.18 | 108.39 | 34.79 | 1424.34 | 404.06 | 2248.8 | 668.15 | 327.45 | 340.7 | 1252.65 | 958.63 | 759.94 | 198.69 | 286.63 | 142.36 | 144.27 | 7.39 | 327.99 | 2750.57 | 4931.34 |
| 2013:Q4 | 5351.05 | 70.85 | 134.01 | 381.27 | 126.79 | 474.71 | 1930.15 | 657.51 | 1229.22 | 43.42 | 149.23 | 102.68 | 46.55 | 1618.21 | 465.82 | 2294.94 | 579.54 | 290.07 | 289.47 | 1392.8 | 1083.19 | 862.97 | 220.22 | 301.88 | 144.85 | 157.04 | 7.73 | 322.6 | 3056.11 | 5253.12 |
| 2014:Q1 | 5544.42 | 82.19 | 146.01 | 386.11 | 128.38 | 566.71 | 1987.79 | 679 | 1261.15 | 47.65 | 154.05 | 110.86 | 43.19 | 1661.02 | 432.17 | 2437.48 | 558.01 | 257.69 | 300.32 | 1461.47 | 1139.93 | 910.72 | 229.21 | 310.31 | 124.12 | 186.19 | 11.24 | 418 | 3106.94 | 5260.63 |
| 2014:Q2 | 5778.9 | 78.69 | 154.69 | 398.58 | 139.39 | 572.42 | 2046.27 | 623.35 | 1360.35 | 62.57 | 161.7 | 113.66 | 48.04 | 1775.42 | 451.74 | 2511.54 | 605.29 | 275.4 | 329.89 | 1433.12 | 1123.5 | 876.48 | 247.02 | 296.67 | 106.49 | 190.18 | 12.94 | 473.13 | 3267.36 | 5167 |
| 2014:Q3 | 5884.37 | 86.14 | 153.13 | 421.47 | 132.2 | 617.23 | 2131.56 | 710.63 | 1351.8 | 69.12 | 160.53 | 113.42 | 47.11 | 1743.04 | 439.06 | 2642.09 | 635.54 | 293.52 | 342.02 | 1441.53 | 1114.58 | 847.2 | 267.38 | 314.08 | 121.19 | 192.89 | 12.87 | 565.02 | 3242.28 | 5306.15 |
| 2014:Q4 | 5925.97 | 77.6 | 161.89 | 426.51 | 166.39 | 553.66 | 2058.88 | 660.02 | 1334.5 | 64.36 | 168.16 | 116.35 | 51.81 | 1810.08 | 502.78 | 2565.21 | 614.55 | 302.28 | 312.27 | 1486.4 | 1168.91 | 896.95 | 271.97 | 307.43 | 122.59 | 184.85 | 10.05 | 464.26 | 3360.76 | 4655.47 |
| 2015:Q1 | 6350.43 | 91.42 | 162.73 | 398.79 | 159.67 | 583.07 | 2337.87 | 754.92 | 1516.57 | 66.39 | 167.34 | 116.63 | 50.71 | 1887.13 | 562.41 | 2814.97 | 728.29 | 375.16 | 353.13 | 1527.28 | 1217.2 | 959.31 | 257.88 | 301.08 | 104.45 | 196.63 | 9 | 559.4 | 3535.46 | 5087.53 |
| 2015:Q2 | 6277.1 | 71.11 | 150.12 | 392.14 | 163.62 | 555.92 | 2243.31 | 727.8 | 1452.3 | 63.2 | 169.72 | 118.96 | 50.76 | 1974.95 | 556.2 | 2725.15 | 713.89 | 375.88 | 338.02 | 1554.87 | 1263.15 | 980.11 | 283.04 | 279.78 | 130.41 | 149.37 | 11.94 | 456.38 | 3551.95 | 4668.83 |
| 2015:Q3 | 6191.98 | 68.33 | 170.8 | 394.34 | 162.35 | 566 | 2268.08 | 743.58 | 1458.71 | 65.79 | 164.77 | 110.28 | 54.5 | 1800.15 | 597.16 | 2744.57 | 794.55 | 418.25 | 376.3 | 1470.24 | 1181.88 | 915.65 | 266.23 | 275.69 | 125.74 | 149.95 | 12.67 | 479.78 | 3447.41 | 4934.26 |
| 2015:Q4 | 6037.1 | 62 | 179.52 | 397.97 | 178.31 | 519.42 | 2133.7 | 701.37 | 1371.95 | 60.38 | 164.3 | 108.7 | 55.61 | 1830.64 | 571.23 | 2592.98 | 673.07 | 358.14 | 314.93 | 1468.26 | 1161.42 | 893.64 | 267.78 | 295.21 | 138.36 | 156.85 | 11.63 | 451.65 | 3444.12 | 4607.14 |
| 2016:Q1 | 6063.07 | 75.49 | 184.03 | 417.65 | 163.11 | 550.11 | 2228.16 | 754.83 | 1410.53 | 62.8 | 169.06 | 109.05 | 60.01 | 1726.54 | 548.92 | 2703.13 | 783.41 | 413.82 | 369.59 | 1431.35 | 1117.15 | 859.15 | 257.99 | 302.45 | 149.97 | 152.47 | 11.75 | 488.37 | 3359.94 | 5060.3 |
| 2016:Q2 | 6241.18 | 86.93 | 193.71 | 416.13 | 181.42 | 561.88 | 2401.83 | 868.14 | 1451.78 | 81.91 | 173.09 | 112.86 | 60.23 | 1695.33 | 530.87 | 2838.07 | 794.74 | 412.3 | 382.43 | 1450.79 | 1132.82 | 845.21 | 287.61 | 306.84 | 150.52 | 156.32 | 11.14 | 592.54 | 3403.12 | 5232.76 |
| 2016:Q3 | 6399.52 | 86.4 | 175.25 | 385.57 | 177.06 | 615.05 | 2366.65 | 870.68 | 1436.1 | 59.86 | 186.48 | 120.69 | 65.79 | 1821.18 | 585.88 | 2932.54 | 839.24 | 454.07 | 385.17 | 1571.97 | 1251.56 | 955.62 | 295.94 | 307.53 | 153.07 | 154.46 | 12.89 | 521.33 | 3466.98 | 5415.58 |
| 2016:Q4 | 6409.75 | 86.5 | 160.47 | 370.89 | 189.46 | 690.74 | 2265.77 | 797.48 | 1415.76 | 52.54 | 191.79 | 123.29 | 68.5 | 1824.79 | 629.32 | 2908.51 | 772.28 | 406.66 | 365.62 | 1611.6 | 1260.23 | 956.93 | 303.3 | 337.18 | 166.42 | 170.77 | 14.18 | 524.63 | 3501.24 | 5137.43 |
| 2017:Q1 | 6697.45 | 92.85 | 166.77 | 369.45 | 166.07 | 796.3 | 2365.72 | 810.56 | 1498.32 | 56.84 | 193.77 | 124.16 | 69.61 | 1962.41 | 584.11 | 3111.79 | 829.93 | 416.59 | 413.34 | 1728.44 | 1360.75 | 1033.86 | 326.9 | 351.24 | 161.21 | 190.02 | 16.46 | 553.41 | 3585.66 | 5620.49 |
| 2017:Q2 | 6823.72 | 94.87 | 169.4 | 371.9 | 173.19 | 829.59 | 2307.48 | 757.62 | 1482.97 | 66.89 | 213.4 | 145.01 | 68.39 | 2017.64 | 646.25 | 3175.92 | 879.79 | 445.01 | 434.78 | 1804.35 | 1425.45 | 1061.63 | 363.82 | 365.83 | 171.42 | 194.4 | 13.08 | 491.77 | 3647.8 | 5459.67 |
| 2017:Q3 | 7075.97 | 131.16 | 182.01 | 362.75 | 186.75 | 850.96 | 2387.17 | 778.01 | 1544.82 | 64.34 | 211.87 | 137.38 | 74.49 | 2130.55 | 632.75 | 3329.76 | 796.67 | 390.93 | 405.74 | 1940.41 | 1544.41 | 1152.22 | 392.18 | 381.73 | 176.55 | 205.18 | 14.27 | 592.68 | 3746.21 | 6013.04 |
| 2017:Q4 | 7177.63 | 105.78 | 161.84 | 358.91 | 195.63 | 822.45 | 2368.83 | 778.11 | 1526.55 | 64.18 | 220.86 | 142.62 | 78.25 | 2273.14 | 670.19 | 3296.33 | 762.95 | 377.33 | 385.62 | 1982.3 | 1569.19 | 1180.71 | 388.48 | 396.29 | 182.35 | 213.94 | 16.81 | 551.09 | 3881.3 | 6587.96 |
| 2018:Q1 | 7357.27 | 130.56 | 157.23 | 367.04 | 186.32 | 919.25 | 2476.53 | 748.26 | 1667.25 | 61.01 | 236.6 | 149.87 | 86.73 | 2256.9 | 626.85 | 3425.32 | 860.21 | 413.19 | 447.02 | 2053.04 | 1601.24 | 1211.66 | 389.58 | 435 | 195.67 | 239.34 | 16.79 | 512.07 | 3931.95 | 9668.54 |
| 2018:Q2 | 7590.1 | 127.64 | 148.34 | 383.77 | 183.29 | 878.57 | 2648.6 | 892.3 | 1685.53 | 70.77 | 247.36 | 149.93 | 97.43 | 2305.13 | 667.4 | 3612.22 | 987.87 | 530.78 | 457.08 | 2166.83 | 1717.03 | 1311.81 | 405.21 | 433.24 | 201.77 | 231.47 | 16.56 | 457.52 | 3977.88 | 8131.63 |
| 2018:Q3 | 7732.51 | 117.6 | 166.24 | 380.91 | 193.03 | 905.24 | 2725.16 | 958.96 | 1689.49 | 76.71 | 257.14 | 155.13 | 102.01 | 2330.08 | 657.11 | 3734.72 | 958.05 | 521.28 | 436.77 | 2229.86 | 1793.77 | 1349.55 | 444.23 | 421.18 | 208.14 | 213.04 | 14.91 | 546.81 | 3997.79 | 6539.58 |
| 2018:Q4 | 7487.33 | 114.04 | 167.23 | 376.76 | 223.67 | 925.26 | 2790.3 | 1078.62 | 1631.33 | 80.35 | 265.68 | 159.57 | 106.11 | 1979.44 | 644.96 | 3732.07 | 1208.02 | 689.66 | 518.36 | 1899.05 | 1454.03 | 1103.42 | 350.6 | 431.05 | 208.03 | 223.02 | 13.97 | 625 | 3755.26 | 6297.7 |
| 2019:Q1 | 7864.09 | 124.9 | 168.29 | 426.82 | 184.83 | 976.42 | 2955.63 | 1206.47 | 1680.01 | 69.15 | 289.06 | 172.95 | 116.11 | 2200.95 | 537.18 | 3951.55 | 1357.05 | 764.55 | 592.51 | 2055.28 | 1595.8 | 1221.71 | 374.09 | 444.66 | 223.96 | 220.7 | 14.82 | 539.22 | 3912.54 | 7381.33 |
| 2019:Q2 | 8100.68 | 124.68 | 164.23 | 434.17 | 183.95 | 867.77 | 3146.99 | 1364.23 | 1715.78 | 66.99 | 296.54 | 180.93 | 115.61 | 2262.74 | 619.61 | 4112.08 | 1429.06 | 803.19 | 625.86 | 2100.64 | 1609.25 | 1255.51 | 353.74 | 473.52 | 234.31 | 239.21 | 17.88 | 582.38 | 3988.6 | 7484.9 |
| 2019:Q3 | 7958.43 | 131.83 | 156.36 | 444.55 | 190.97 | 797.95 | 3068.11 | 1303.95 | 1697.46 | 66.69 | 293.09 | 187.08 | 106.01 | 2168.55 | 707.03 | 3976.09 | 1467.03 | 832.63 | 634.4 | 1973.45 | 1515.52 | 1199.48 | 316.05 | 439.81 | 208.8 | 231.02 | 18.12 | 535.61 | 3982.34 | 7525.74 |
| 2019:Q4 | 8113.09 | 129.28 | 151.84 | 452.97 | 205.22 | 837.1 | 3008.97 | 1226.57 | 1718.94 | 63.46 | 315.39 | 199.01 | 116.38 | 2378.44 | 633.87 | 4015.67 | 1440.39 | 798.94 | 641.45 | 2099.78 | 1584.59 | 1245.72 | 338.88 | 494.74 | 241.69 | 253.06 | 20.45 | 475.5 | 4097.42 | 7337.23 |
| 2020:Q1 | 7628.48 | 118.36 | 189.92 | 461.32 | 251.32 | 902.31 | 2960.12 | 1208.01 | 1690.18 | 61.92 | 308.33 | 201.88 | 106.45 | 1787.47 | 649.34 | 3913.48 | 1520.92 | 808.16 | 712.76 | 1716.69 | 1204.6 | 975.03 | 229.57 | 488.4 | 250.39 | 238.01 | 23.69 | 675.86 | 3715.01 | 6798.39 |
| 2020:Q2 | 7682.05 | 134.47 | 162.54 | 392.09 | 221.31 | 827.93 | 2819.79 | 988.99 | 1770.78 | 60.01 | 329.63 | 211.2 | 118.43 | 2141.37 | 652.93 | 3644.13 | 1273.67 | 672.49 | 601.18 | 1910.14 | 1443.83 | 1176.38 | 267.46 | 451.38 | 219.98 | 231.4 | 14.93 | 460.32 | 4037.92 | 6190.89 |
| 2020:Q3 | 8118.12 | 106.15 | 164.11 | 365.66 | 200.64 | 936.16 | 2981.25 | 1030.23 | 1889.13 | 61.89 | 359.53 | 233.28 | 126.25 | 2351.95 | 652.66 | 3861.24 | 1437.53 | 703.93 | 733.6 | 2060.42 | 1564.46 | 1282.62 | 281.85 | 481.4 | 210.9 | 270.5 | 14.56 | 363.28 | 4256.88 | 7643.65 |
| 2020:Q4 | 8465.99 | 122.96 | 162.29 | 384.13 | 201.47 | 874.82 | 2878.87 | 913.47 | 1903.89 | 61.51 | 356.2 | 234.78 | 121.42 | 2757.55 | 727.69 | 3965.82 | 1302.01 | 655.28 | 646.73 | 2244.66 | 1792.32 | 1475.44 | 316.88 | 436.6 | 213.1 | 223.49 | 15.74 | 419.15 | 4500.16 | 7653.73 |
| 2021:Q1 | 8557.92 | 130.87 | 168.95 | 430.53 | 205.06 | 1006.23 | 2629.78 | 813.53 | 1761.43 | 54.82 | 389.34 | 258.91 | 130.43 | 2898.39 | 698.76 | 3938.6 | 1151.14 | 576.73 | 574.4 | 2426.78 | 1889.83 | 1546.33 | 343.49 | 519.39 | 264.59 | 254.8 | 17.56 | 360.69 | 4619.31 | 8560.59 |
| 2021:Q2 | 9225.12 | 138.54 | 184.52 | 507.73 | 200.79 | 1122.88 | 2801.88 | 871.9 | 1879.09 | 50.88 | 399.86 | 266.19 | 133.67 | 3164.75 | 704.19 | 4284.51 | 1191.76 | 567.54 | 624.22 | 2724.53 | 2123.99 | 1774.42 | 349.57 | 581.73 | 293.65 | 288.08 | 18.81 | 368.22 | 4940.61 | 8881.38 |
| 2021:Q3 | 9620.29 | 167.25 | 206.53 | 456.4 | 209.66 | 1227.42 | 3044.03 | 965.07 | 2016.5 | 62.47 | 420.67 | 279.92 | 140.75 | 3070.39 | 817.93 | 4585.42 | 1284.31 | 599.57 | 684.75 | 2723.02 | 2102.74 | 1727.9 | 374.84 | 584.72 | 306.39 | 278.32 | 35.56 | 578.09 | 5034.86 | 8892.15 |
| 2021:Q4 | 9681.18 | 157.94 | 189.41 | 484.17 | 241.82 | 1251.57 | 2918.87 | 951.59 | 1908.62 | 58.66 | 442.87 | 294.35 | 148.52 | 3190.87 | 803.66 | 4575.62 | 1229.56 | 589.05 | 640.52 | 2879.63 | 2147.39 | 1766.88 | 380.51 | 678.89 | 358.4 | 320.49 | 53.35 | 466.43 | 5105.56 | 8542.62 |
| 2022:Q1 | 9977.06 | 172.37 | 187.36 | 698.32 | 240.56 | 1296.78 | 3078.69 | 1068.95 | 1955.66 | 54.08 | 469.43 | 316.68 | 152.75 | 3031.03 | 802.53 | 4567.6 | 1168.28 | 490.96 | 677.31 | 2713.82 | 2025.35 | 1698.21 | 327.14 | 645.33 | 329.01 | 316.32 | 43.14 | 685.5 | 5409.47 | 9218.3 |
| 2022:Q2 | 9286.49 | 186.17 | 176.32 | 483.39 | 266.87 | 1228.58 | 3027.94 | 1134.32 | 1838.78 | 54.84 | 477.56 | 317.42 | 160.13 | 2542.06 | 897.6 | 4508.82 | 1233.41 | 537.58 | 695.82 | 2505.02 | 1831.3 | 1546.67 | 284.63 | 636.48 | 353.25 | 283.23 | 37.24 | 770.39 | 4777.67 | 7907.17 |
| 2022:Q3 | 9082.9 | 162.17 | 165.39 | 478.18 | 256.77 | 1160.58 | 3072.81 | 1087.23 | 1931.77 | 53.81 | 478.45 | 320.11 | 158.34 | 2446.53 | 862.01 | 4379.43 | 1233.4 | 550.25 | 683.15 | 2415.91 | 1759.81 | 1489.44 | 270.38 | 616.07 | 394.71 | 221.37 | 40.02 | 730.12 | 4703.46 | 7837.67 |
| 2022:Q4 | 9119.88 | 172.84 | 178.83 | 489.26 | 247.78 | 1100.6 | 3075.95 | 1093.32 | 1921.59 | 61.04 | 495.15 | 335.16 | 159.99 | 2523.41 | 836.06 | 4438.45 | 1243.71 | 557.57 | 686.15 | 2438.01 | 1764.33 | 1446.76 | 317.58 | 630.53 | 397.97 | 232.56 | 43.14 | 756.74 | 4681.43 | 7542.8 |
| 2023:Q1 | 9406.74 | 159.18 | 228.94 | 469.6 | 218.94 | 1185.84 | 3163.4 | 1198.61 | 1911.55 | 53.24 | 512.55 | 350.73 | 161.83 | 2609.52 | 858.76 | 4602.52 | 1532.97 | 725.12 | 807.85 | 2551.18 | 1899.1 | 1537.94 | 361.16 | 609.19 | 377.65 | 231.54 | 42.89 | 518.37 | 4804.22 | 8001.73 |
| 2023:Q2 | 9821.55 | 185.61 | 200.24 | 482.03 | 200.7 | 1166.03 | 3483.05 | 1413.02 | 2000.45 | 69.58 | 531.06 | 363.23 | 167.83 | 2707.02 | 865.83 | 4971.04 | 1740.48 | 838.73 | 901.75 | 2660.29 | 2033.47 | 1644.56 | 388.92 | 585.28 | 360.86 | 224.42 | 41.54 | 570.28 | 4850.51 | 8195.73 |
| 2023:Q3 | 10138.13 | 158.65 | 174.16 | 448.65 | 190.22 | 1224.29 | 3795.46 | 1644.56 | 2070.32 | 80.58 | 536.98 | 369.84 | 167.14 | 2665.65 | 944.07 | 5263.68 | 1931.64 | 884.31 | 1047.33 | 2601.56 | 1958.33 | 1599.71 | 358.62 | 603.34 | 390.58 | 212.76 | 39.9 | 730.48 | 4874.45 | 8797.49 |
| 2023:Q4 | 10705.12 | 142.79 | 187.75 | 522.45 | 203.08 | 1204.74 | 4162.15 | 1769.4 | 2311.1 | 81.65 | 556.73 | 385.18 | 171.55 | 2810.35 | 915.08 | 5747.67 | 2121.61 | 904.09 | 1217.52 | 2870.37 | 2246.6 | 1813.04 | 433.56 | 585.81 | 392.69 | 193.12 | 37.95 | 755.69 | 4957.46 | 9131.36 |

TLDRS:
- In Q4 2023, hedge fund liabilities surged to $9,131.36 billion, the highest since Q1 2022, marking a $333.87 billion increase from Q3 2023.
- Hedge funds with at least $150 million in private fund assets under management must file Form PF with the SEC.
- Smaller funds file annually, while those managing $500 million or more file quarterly with detailed reports.
- The data includes insights from Form PF, incorporating commodity pools and using responses from specific Form PF questions to estimate asset value splits across different instruments.
- The data covers all hedge funds filing Form PF, including both domestic and foreign funds.
- Domestic hedge funds' assets are often categorized under the household sector, while foreign-domiciled funds fall under the rest of the world sector.
- The provided table displays the aggregate assets and liabilities of all hedge funds filing Form PF, distinguishing it from regular Financial Accounts publications, which only include domestic funds.

In 2023:Q4 hedge fund liabilities hit $9,131.36 billion (the highest since 2022:Q1) up $333.87 billion from $8,797.49 billion in 2023:Q3. Hedgies r fuk!
by u/Dismal-Jellyfish in Superstonk
In 2023:Q4 hedge fund liabilities hit $9,131.36 billion (the highest since 2022:Q1) and up $333.87 billion from $8,797.49 billion in 2023:Q3.https://t.co/aRTI0cRSoW
— dismal-jellyfish (@DismalJellyfish) June 14, 2024