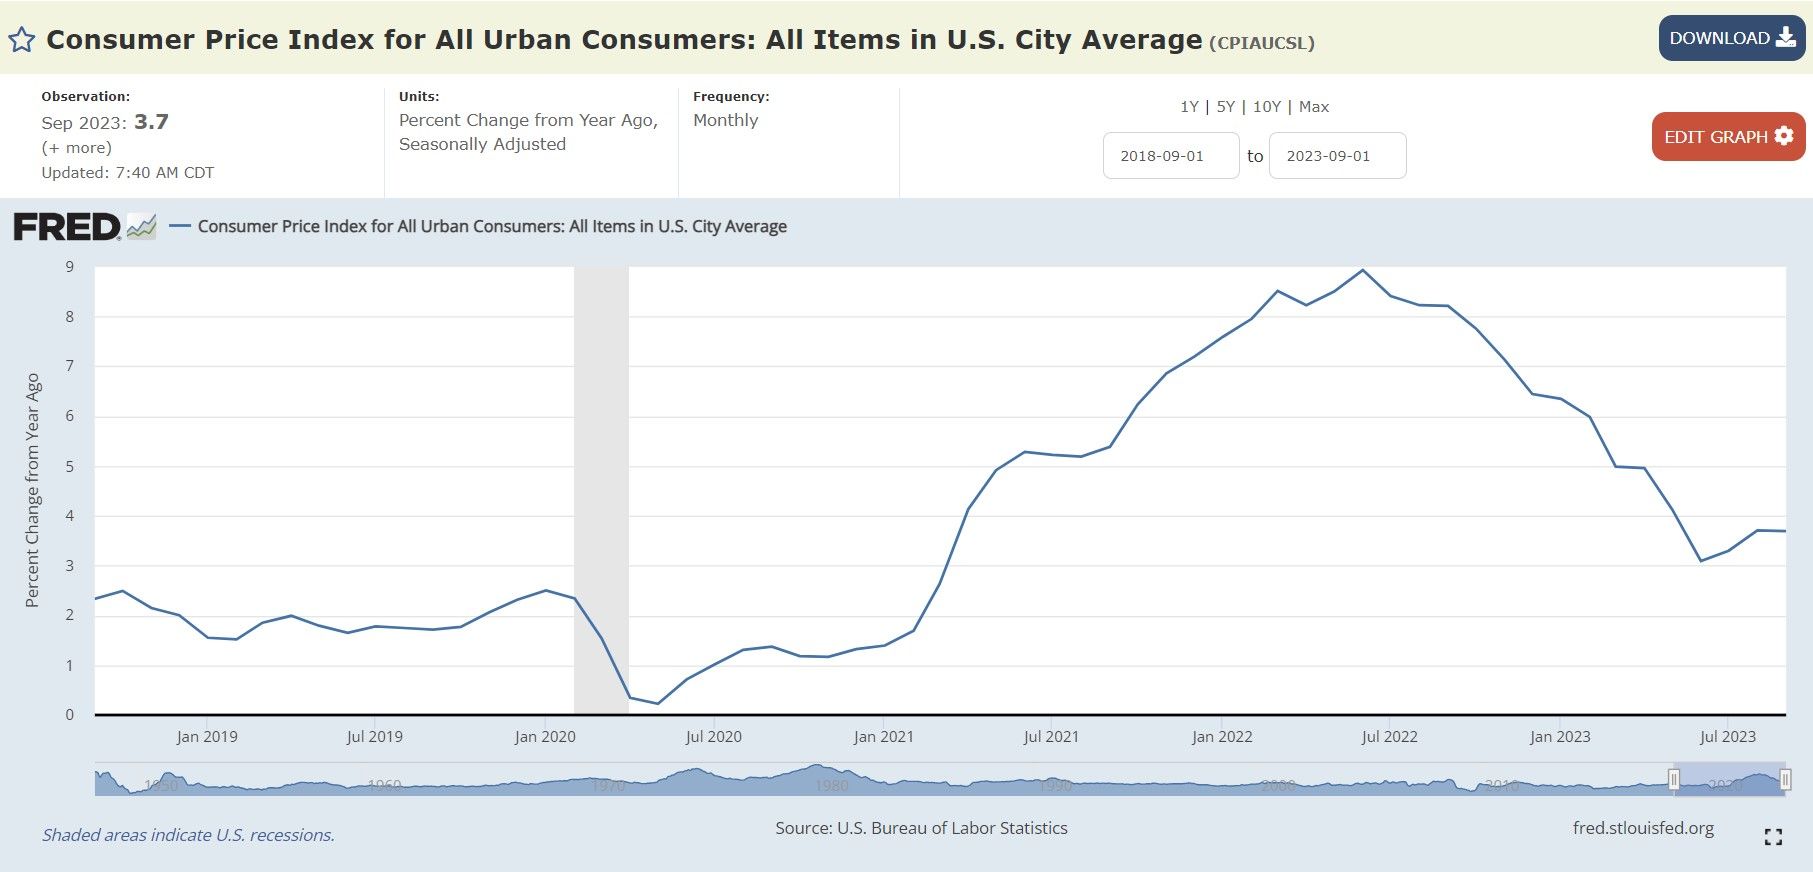
Inflation Alert! The acceleration of inflation continues: CPI for all items rises 0.4% in September and rose 3.7% over the last 12 months.
The Consumer Price Index (CPI) rose by 0.4% in September from August.
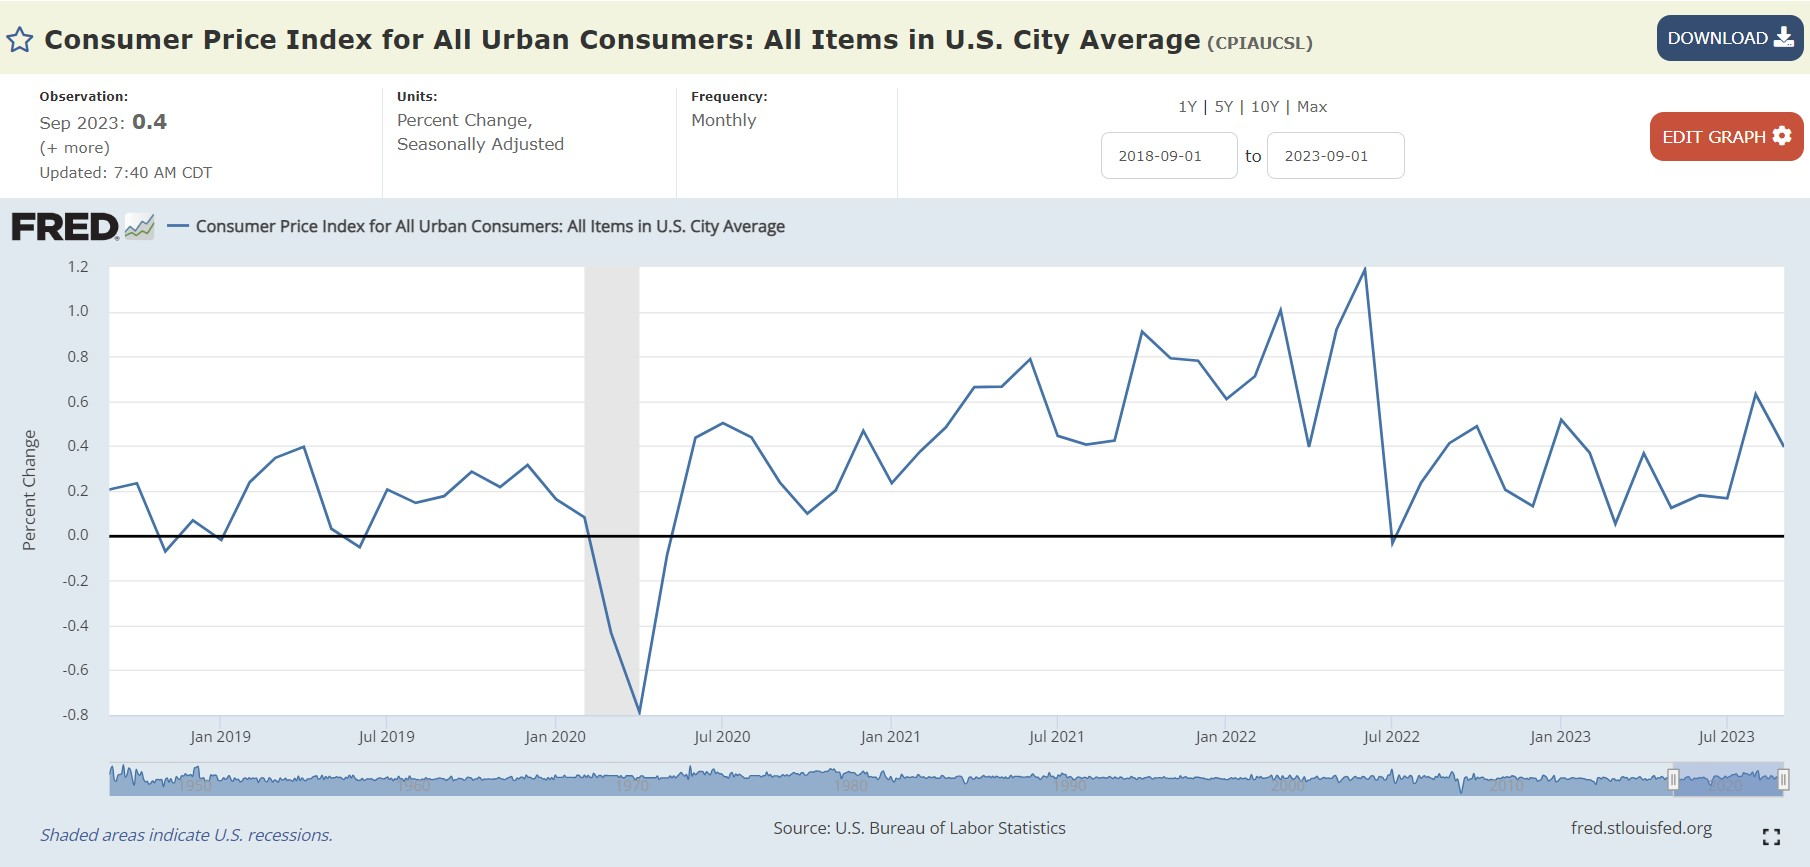
With month-to-month inflation continuing to grow, over the last 12 months, the all items index increased 3.7%. This is all on the heels of a red-hot August (.6% month-to-month, 3.7% year-over-year). Inflation is not slowing down!
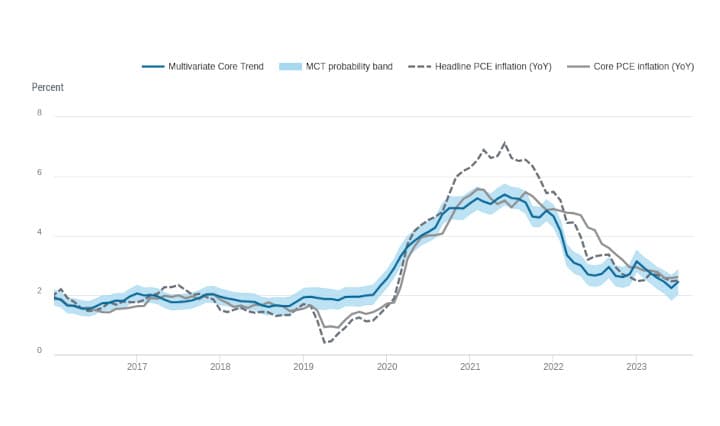
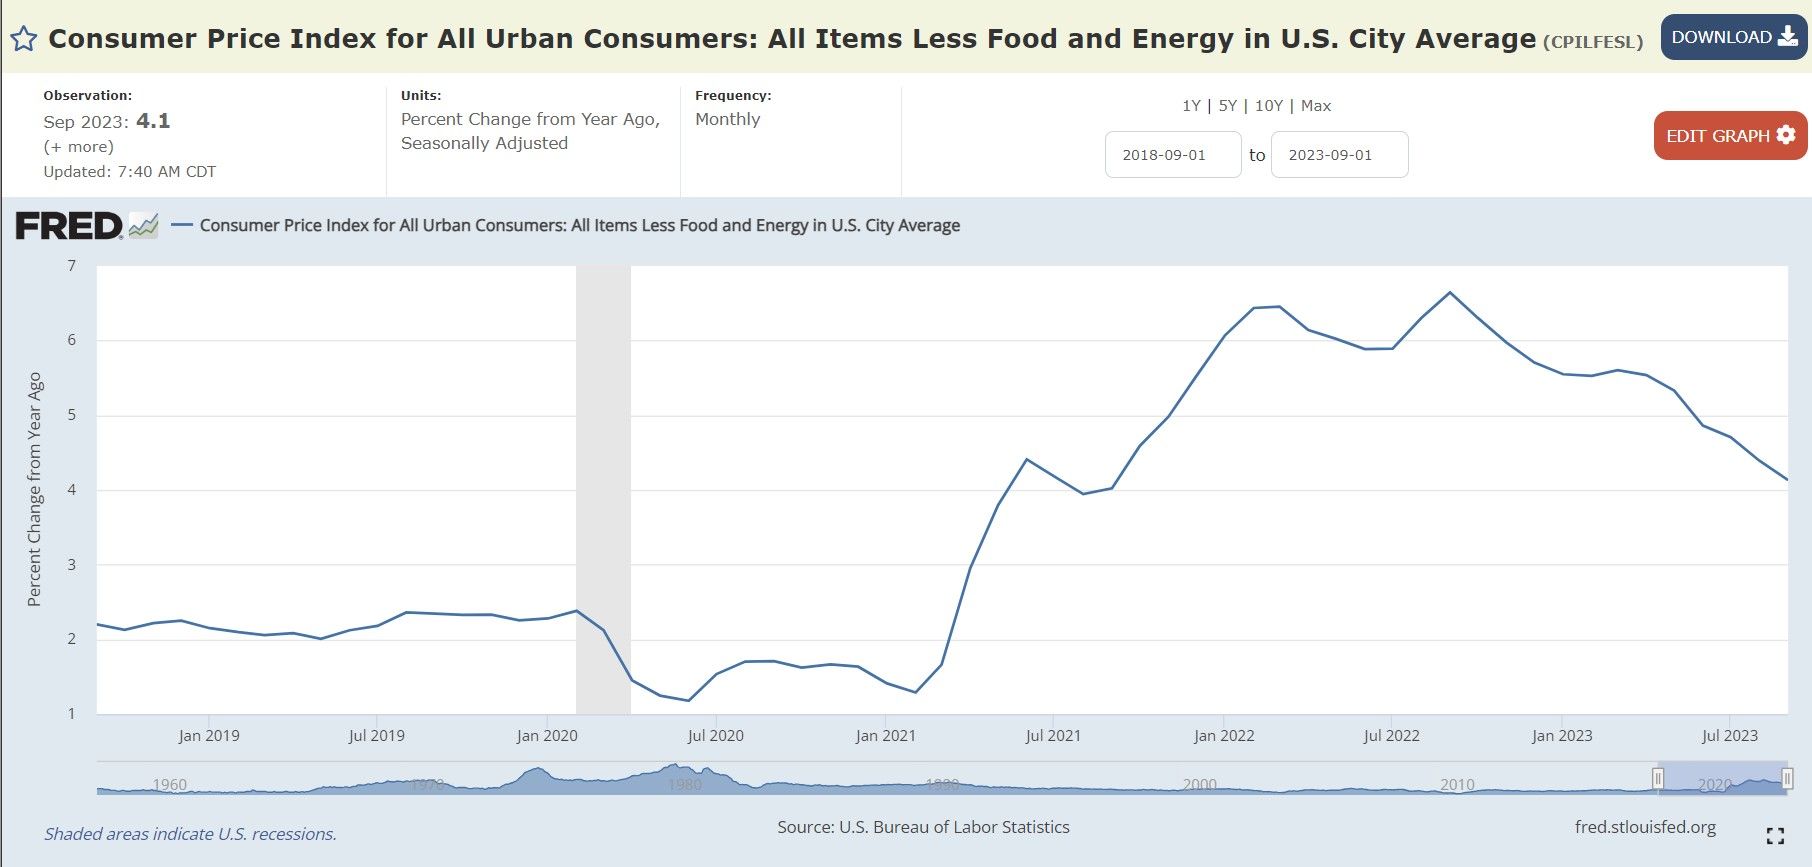
The index for all items less food and energy, which strips out 'volatile' products like food and energy rose 4.1% percent over the last 12 months:
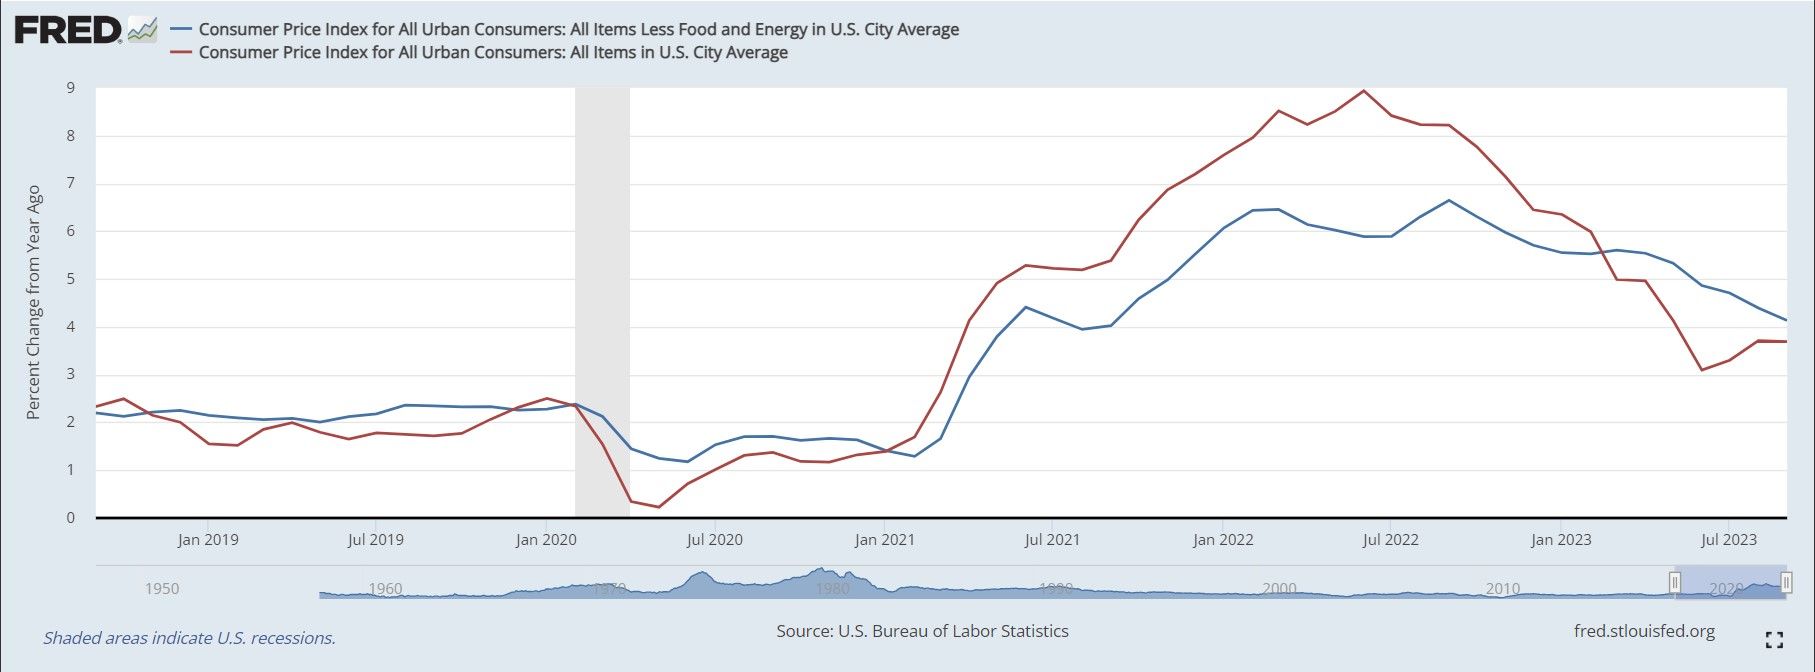
With the index for all items less food and energy ABOVE CPI, inflation will continue to rage:
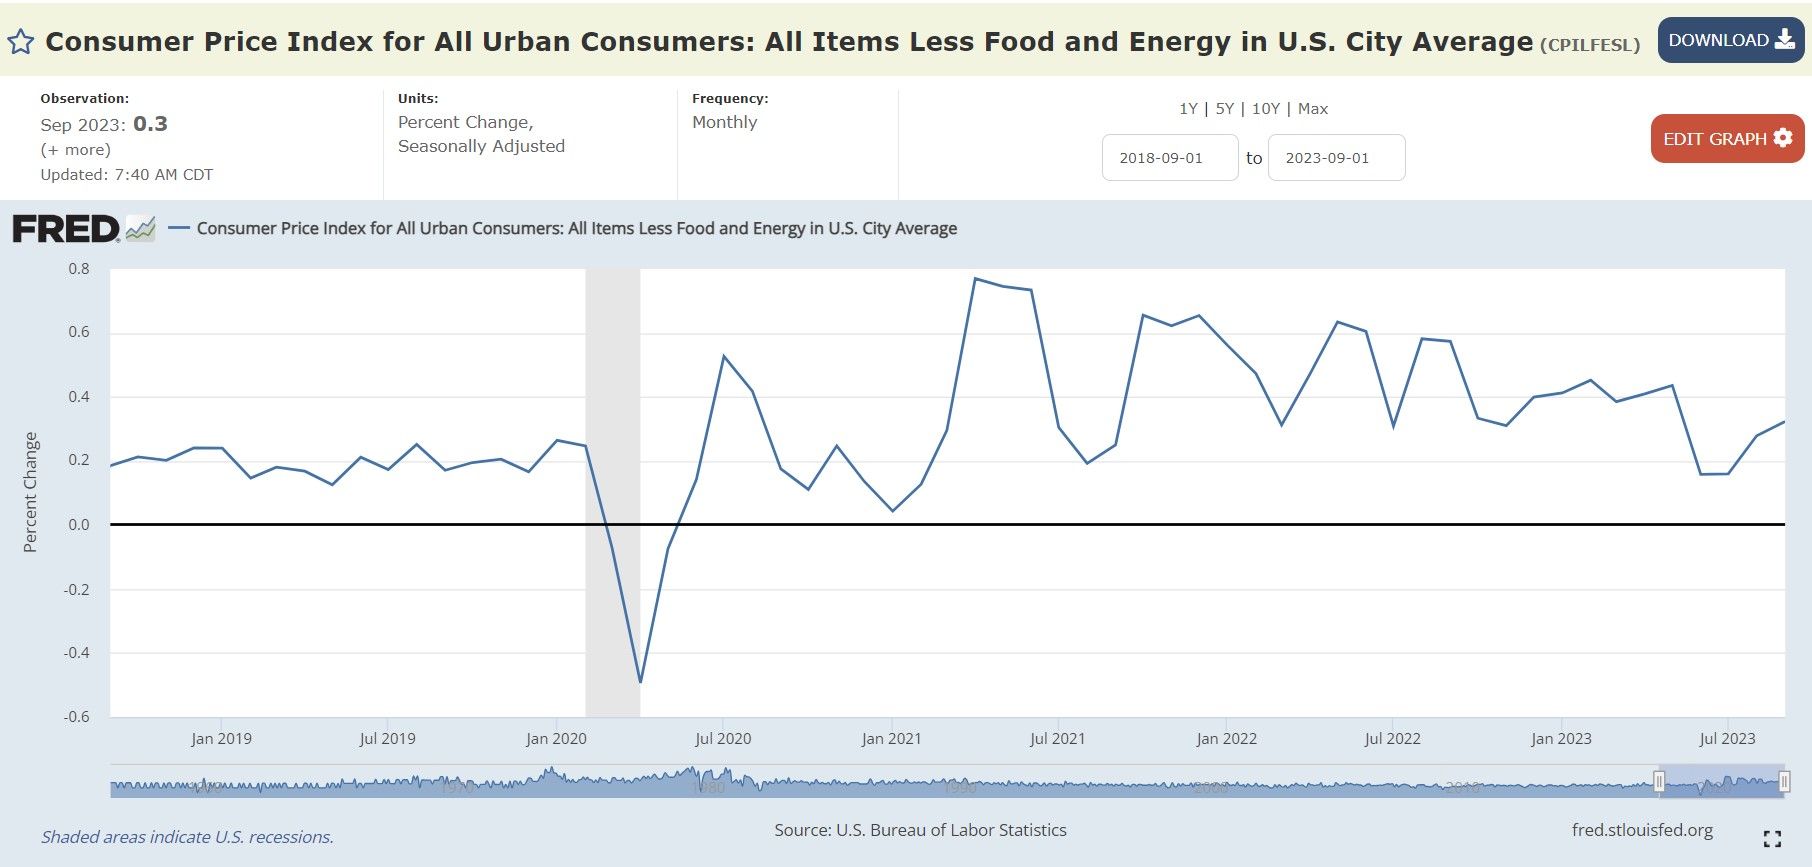
Monthly, the index for all items less food and energy for had been held down by artificial depression on health insurance cpi, but is still accelerating month-over-month:
Real quick, let's talk about insurance adjustments to CPI
Every year in October, there's a change made to how we measure the cost of health insurance. This change is spread out over the next 12 months. This started last October and will end this September.
Figuring out how much health insurance costs can be tricky. It's not just about how much you pay monthly (premiums) but also other costs like when you visit the doctor (co-pays) or the maximum amount you might have to pay in a year (out-of-pocket maximums). Plus, there are so many different insurance plans, and they can be different depending on where you live.
The Bureau of Labor Statistics (BLS for short) is tasked with measuring these costs, uses a special method to estimate these changes. Every fall, they adjust their numbers based on new information. They look at how much insurance companies earn and use that to make their estimates. This means that the monthly changes in health insurance costs are pretty much the same for a whole year, and then they change it up again.
Usually, this yearly change isn't a big deal. But last year, the change was massive and had some big effects (artificially pushing CPI down for health).
For the year leading up to September 2022, the way they measured the cost of health insurance was a bit off. By that September, they said health insurance costs had gone up by 28% compared to the year before, which made it seem like prices were rising really fast.
But then in October 2022, they made their yearly change, and suddenly the numbers showed that health insurance costs were dropping every month. Medical Care/Insurance making up over 6% of total CPI being reported artificially low has suppressed CPI in this category and overall.
However, as called out, this is going away. This month, BLS will make a new adjustment that will be applied to health insurance CPI for 12 months through September 2024 that will swing the other way.
Fuel prices are pushing up CPI and appear poised to keep doing so
The gasoline index increased 2.1 percent in September, following a 10.6-percent increase in the previous month. (Before seasonal adjustment, gasoline prices rose 0.6 percent in September.)
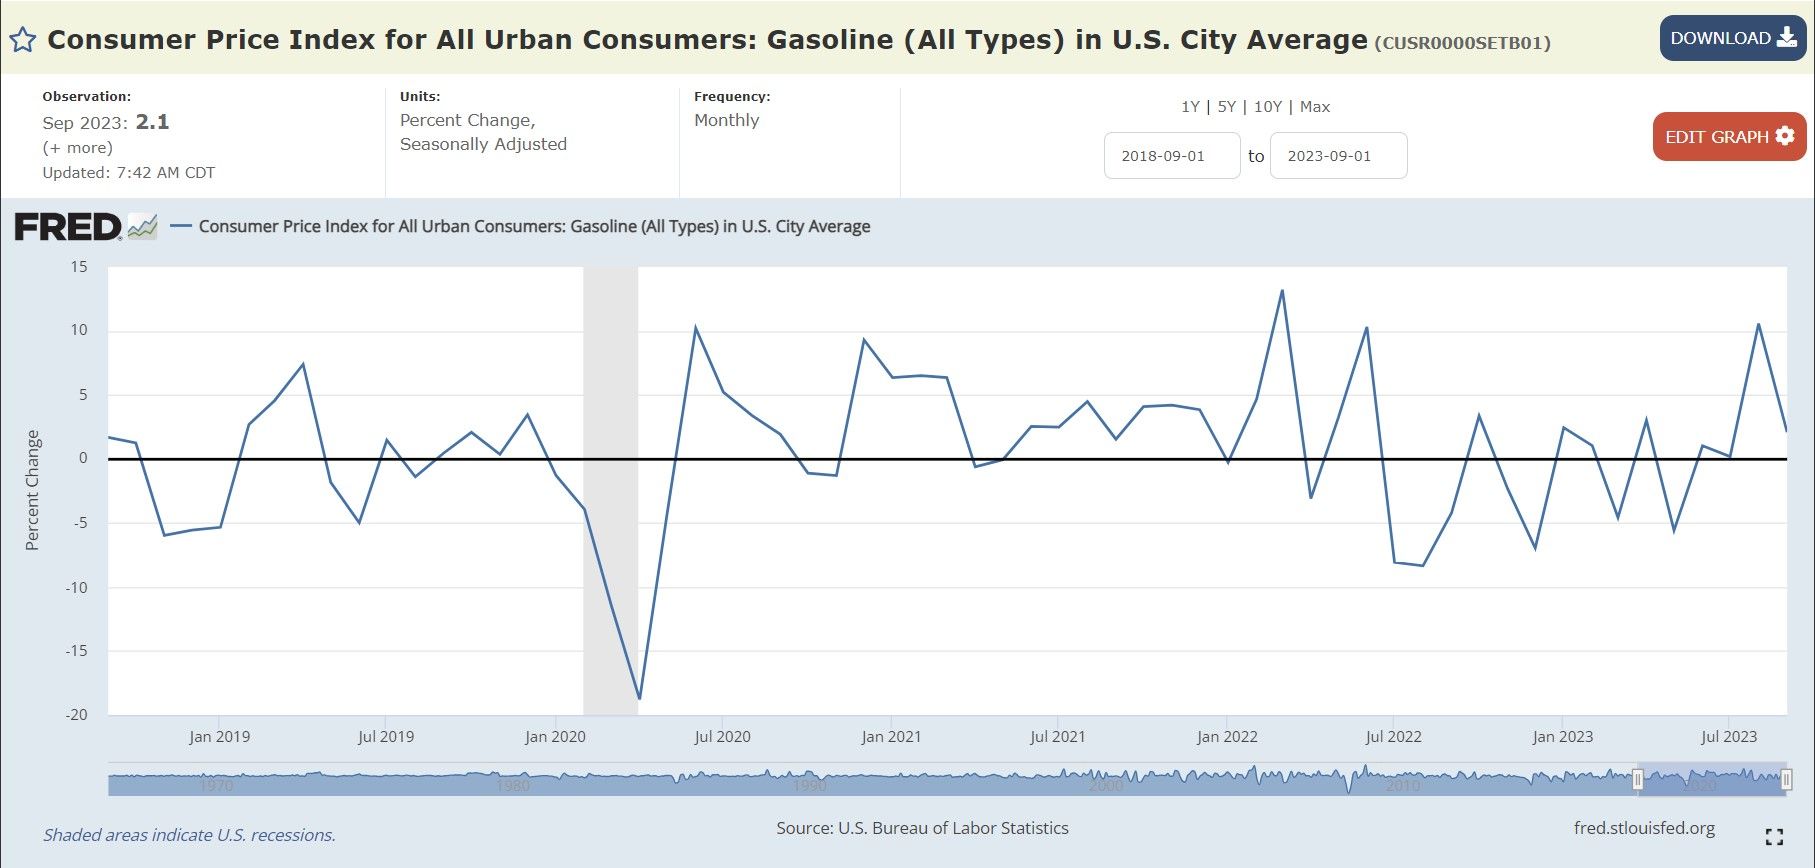
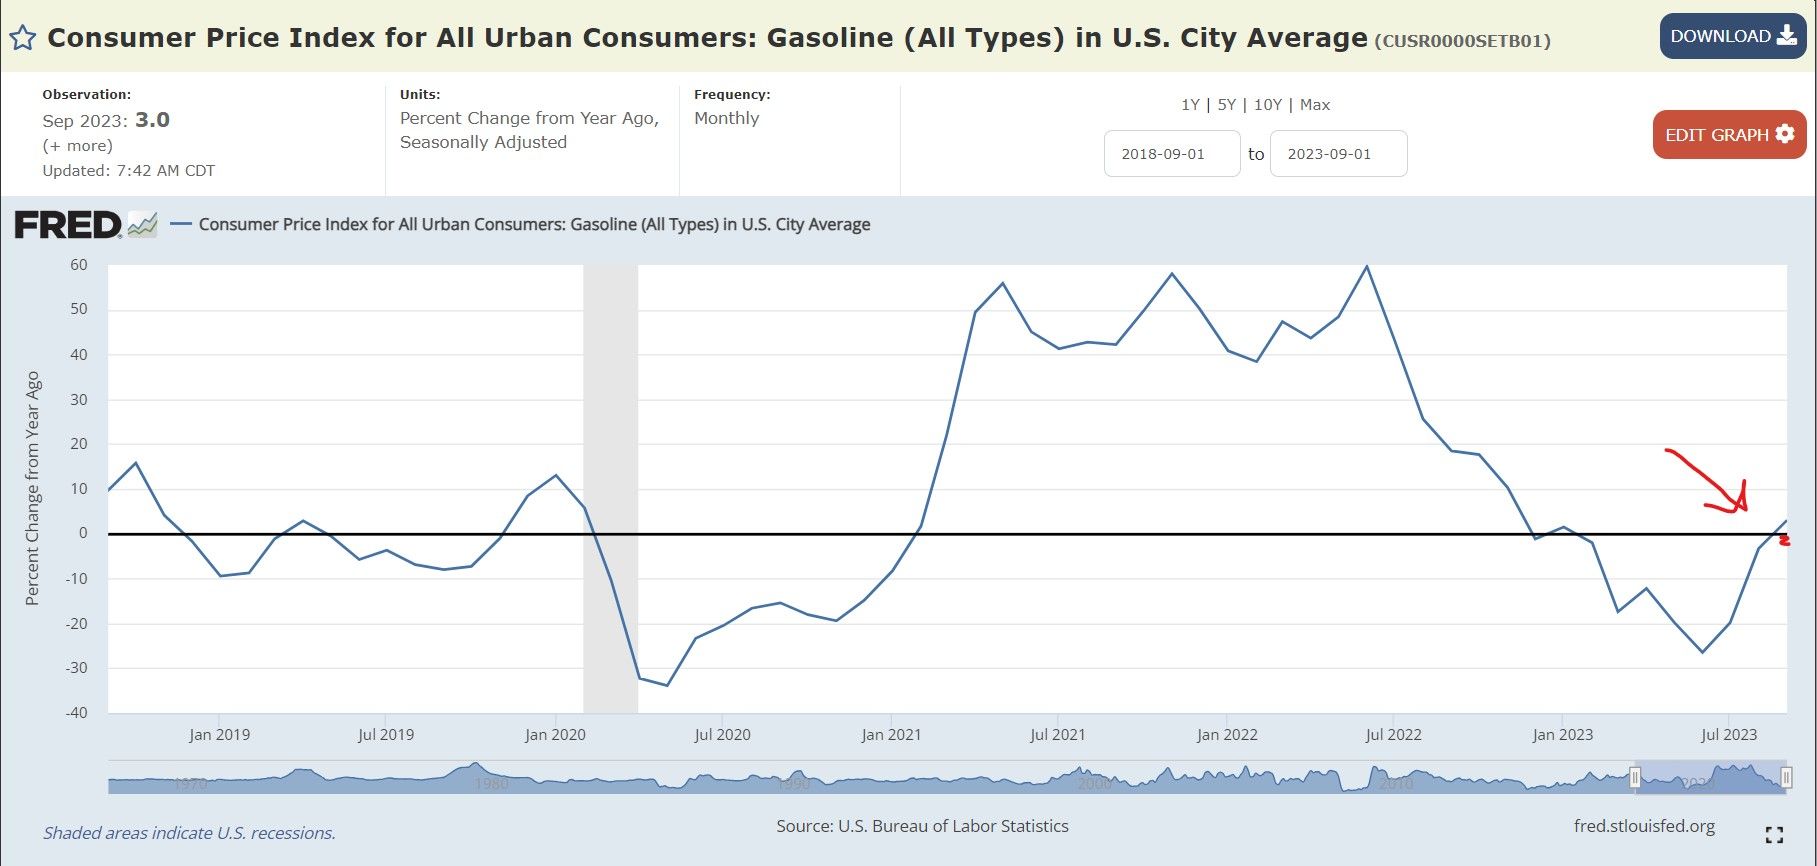
Gasoline accounts for about half of the total energy CPI. Note that gasoline had been negative year-over-year but flipped to 'positive', and will become bigger drivers of CPI inflation over the coming months:
| CPI for Energy, by Category | MoM | YoY |
|---|---|---|
| Overall Energy CPI | 1.5% | -0.5% |
| Gasoline | 2.1% | 3.0% |
| Utility natural gas | -1.9% | -19.9% |
| Electricity Service | 1.3% | 2.6% |
Gasoline flipping 'positive' has potential to cause all sorts of carnage for CPI in the remainder of the year.
Services CPI by category:
| Major Services without Energy | Weight in CPI | MoM | YoY |
|---|---|---|---|
| Services without Energy | 58.34% | 0.5% | 5.7% |
| Owner’s equivalent of rent | 25.6% | 0.6% | 7.1% |
| Rent of primary residence | 7.6% | 0.6% | 7.4% |
| Medical care services | 6.33% | 0.1% | -2.6% |
| Education and communication services | 4.79% | 0.3% | 2.5% |
| Food services (food away from home) | 4.8% | 0.4% | 6.0% |
| Recreation services, admission, movies, concerts, sports events, satellite tv | 3.1% | 0.5% | 6.4% |
| Motor vehicle insurance | 2.74% | 1.2% | 18.9% |
| Other personal services (haircuts, legal services, etc.) | 1.4% | 0.6% | 6.8% |
| Motor vehicle maintenance & repair | 1.1% | .2% | 10.2% |
| Hotels/Motels | 1.1% | .7% | 7.3% |
| Water, Sewer, Trash Collection | 1.1% | 0.2% | 5.2% |
| Video and audio services, cable | 1.0% | 0.5% | -4.4% |
| Airline fares | 0.5% | 0.3% | -13.4% |
| Pet services | 0.5% | 0.7% | 7.0% |
| Tenants’ & Household insurance | 0.369% | 0.9% | 2.8% |
| Car Rental | 0.1% | 0% | -8.6% |
| Postage & delivery | 0.71% | 0.1% | 4.6% |
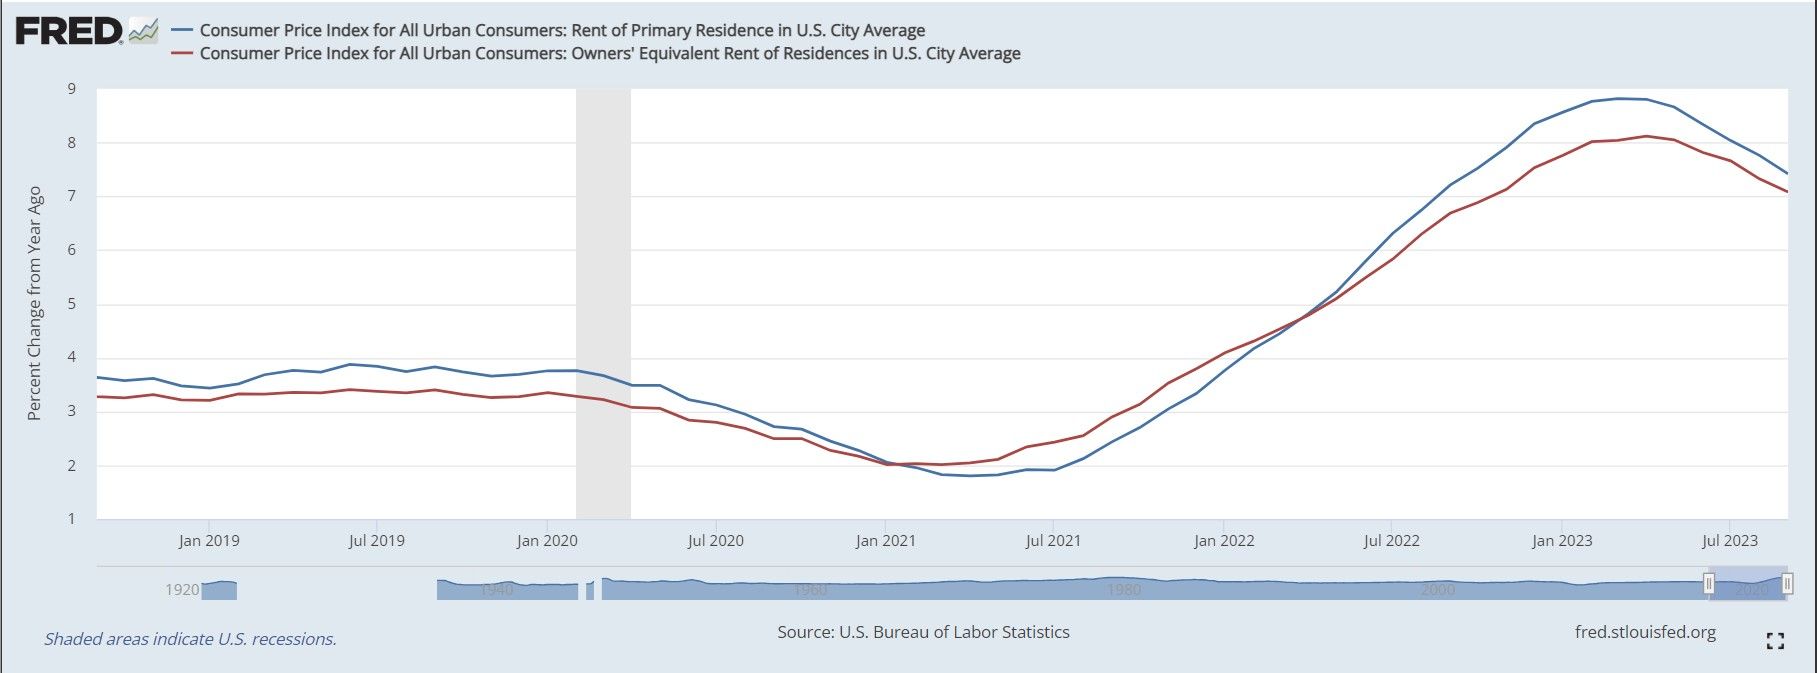
The two CPIs for housing (“shelter”)--over 30% of CPI weighting:
“Rent of primary residence” re-accelerated to +060% for September and 7.4% Year-over-year.
Owner’s equivalent of rent up 0.6% for the month and 7.1% year-over-year.
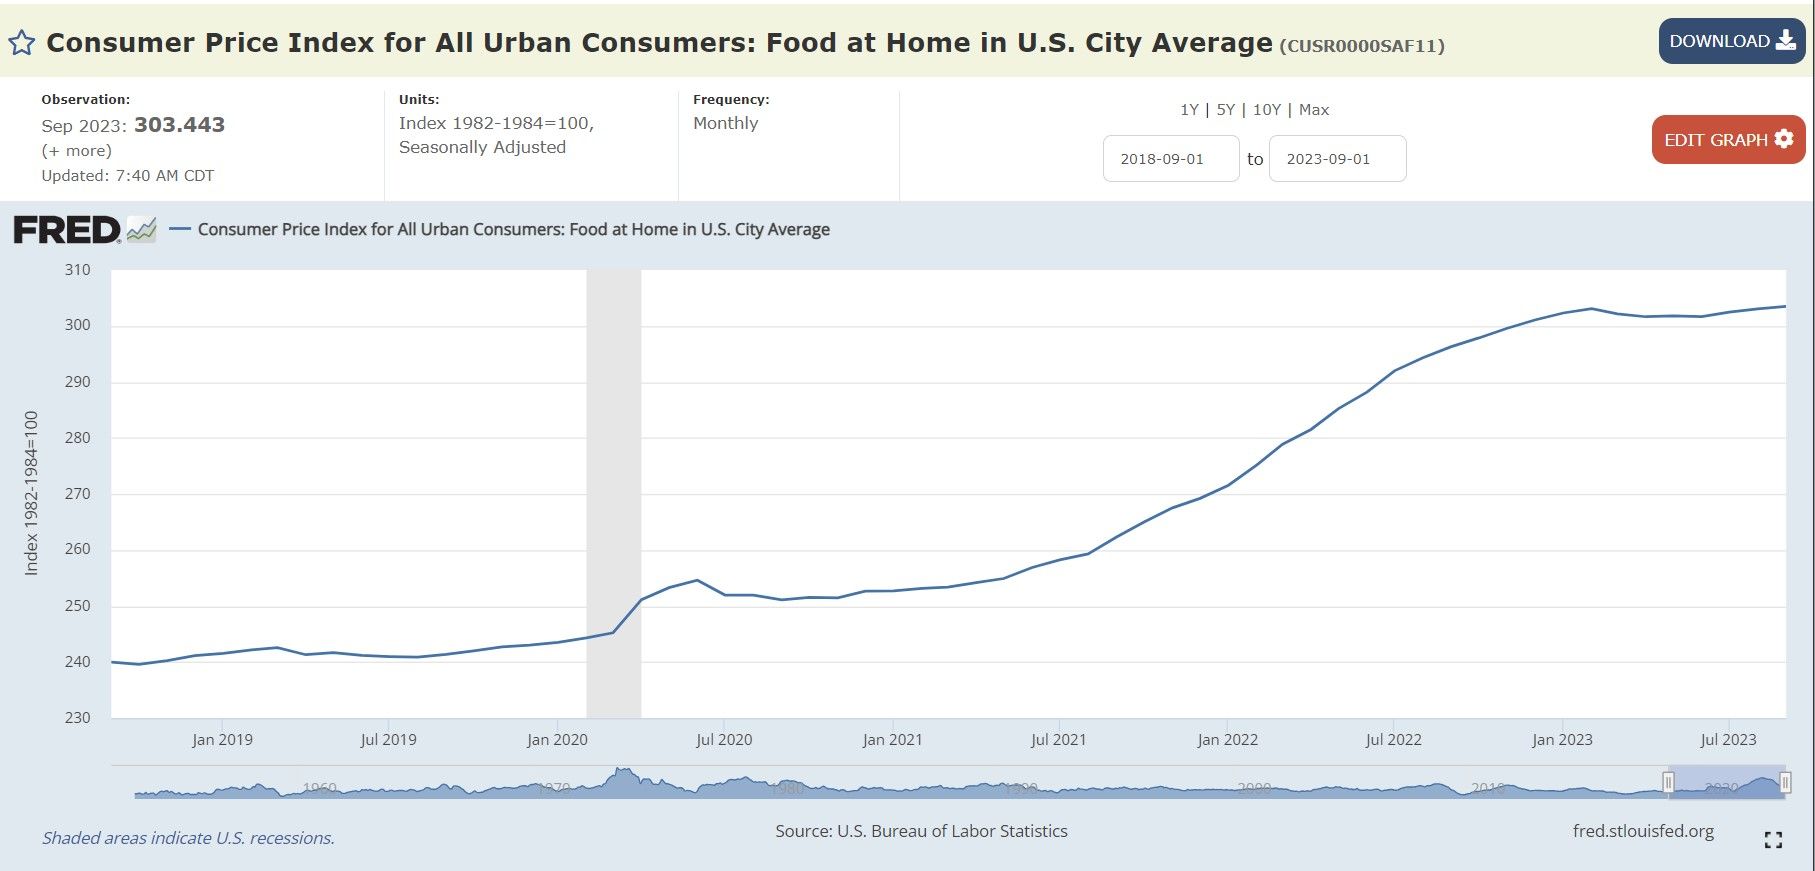
Food at home:
The CPI for “food at home” rose by 0.1% in September from August. The 2.4% year-over-year increase was the smallest in two years since August's 3.0%.
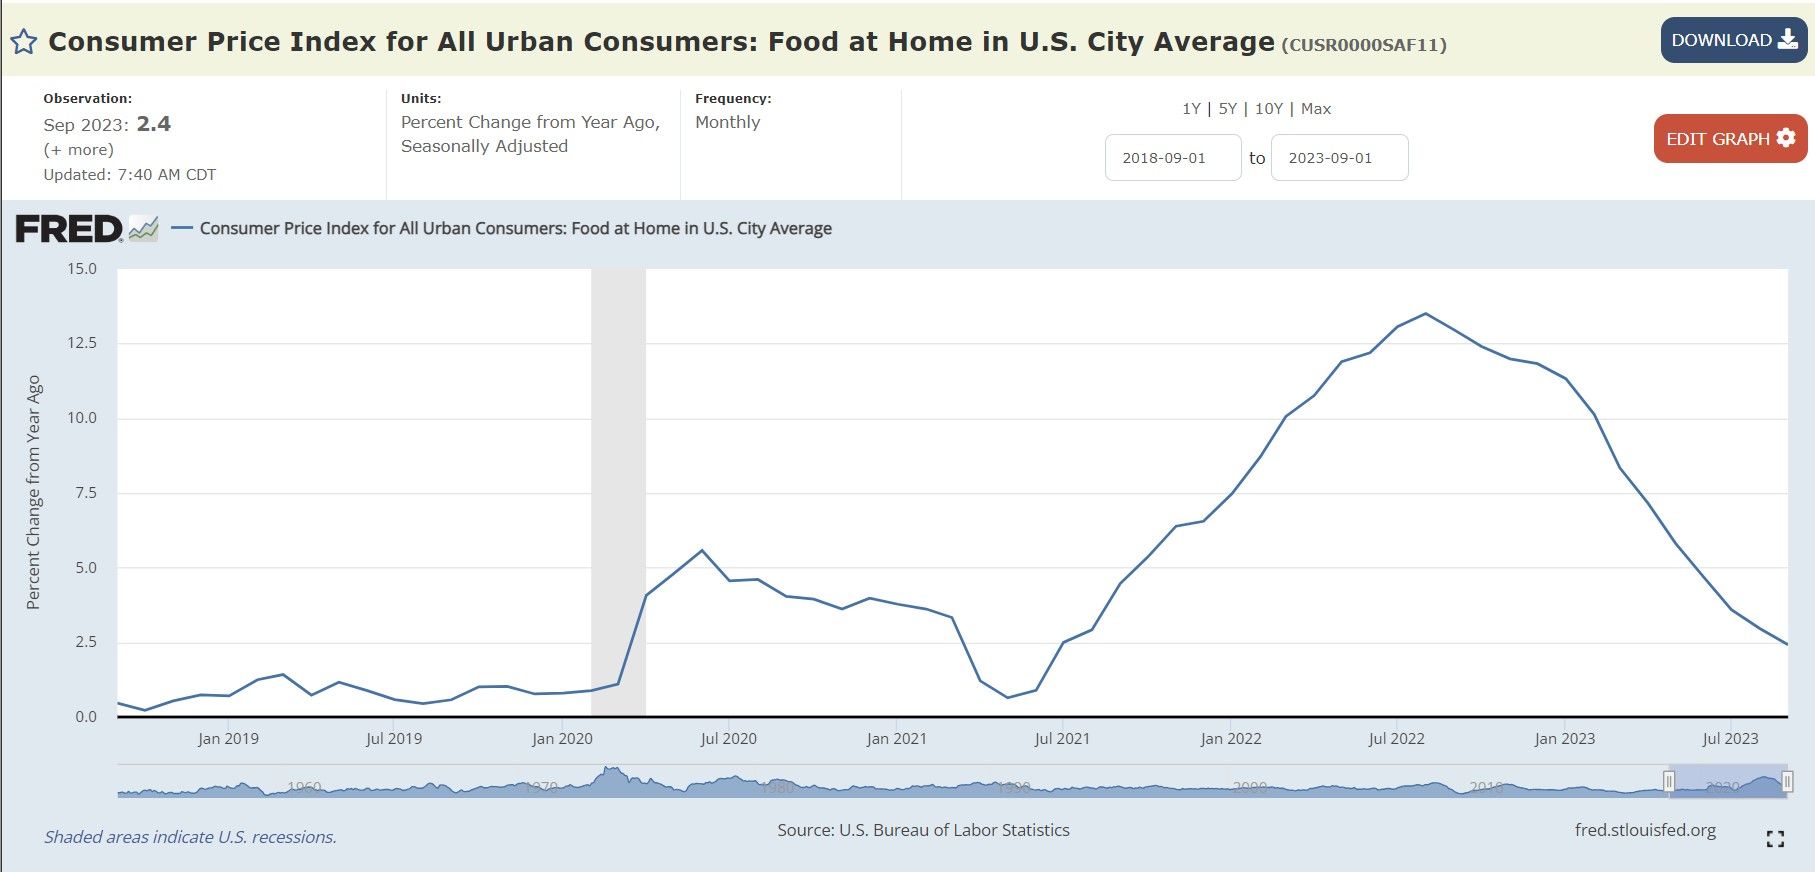
While food prices have started to come down from there crazy pandemic spike, but the true insidious nature of inflation is prices never go all the way back down:
| Food at home by category | MoM | YoY |
|---|---|---|
| Overall Food at home | 0.1% | 2.4% |
| Cereal | 0.4% | 4.8% |
| Beef | 0.6% | 7.0% |
| Poultry | 0.4% | -0.4% |
| Fish | -1.2% | -1.5% |
| Eggs | 0.1% | -14.5% |
| Dairy | 1.4% | -2.1% |
| Butter | 2.4% | -4.0% |
| Fresh Fruits | -0.1% | 0.1% |
| Fresh Vegetables | -0.4% | -1.2% |
| Juice | -0.4% | 4.4% |
| Coffee | 0.7% | 1.6% |
| Fats and Oils | -0.5% | 2.7% |
| Baby Formula | 2.3% | 9.2% |
| Alcoholic beverages at home | 0.8% | 4.2% |

TLDRS:
- (CPI) rose by 0.4% in September from August.
- With month-to-month inflation continuing to grow, over the last 12 months, the all items index increased 3.7%.
- This is all on the heels of a red-hot August (.6% month-to-month, 3.7% year-over-year).
- Inflation is not slowing down!
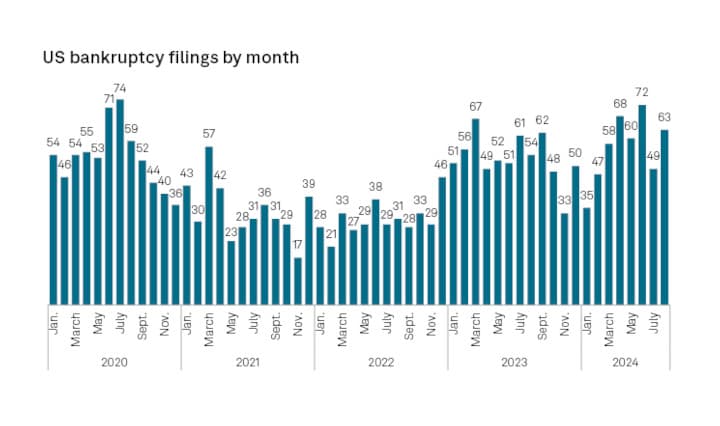
- Reminder, while banks have the liquidity fairy, 'we' get the promise of more rate hikes this year, Atlanta Fed President Raphael Bostic yet again enrichens himself inappropriately from his position.
- To fix one end of their mandate (price stability) from the inflation problem they created, the Fed will continue sacrificing employment (the other end of their mandate) to bolster price stability by continuing to raise interest rates--causing further stress to businesses and households.
- I believe inflation is the match that has been lit that will light the fuse of our rocket.